German vs Barbadian Householder Income Ages 25 - 44 years
COMPARE
German
Barbadian
Householder Income Ages 25 - 44 years
Householder Income Ages 25 - 44 years Comparison
Germans
Barbadians
$93,531
HOUSEHOLDER INCOME AGES 25 - 44 YEARS
36.0/ 100
METRIC RATING
184th/ 347
METRIC RANK
$89,565
HOUSEHOLDER INCOME AGES 25 - 44 YEARS
5.9/ 100
METRIC RATING
224th/ 347
METRIC RANK
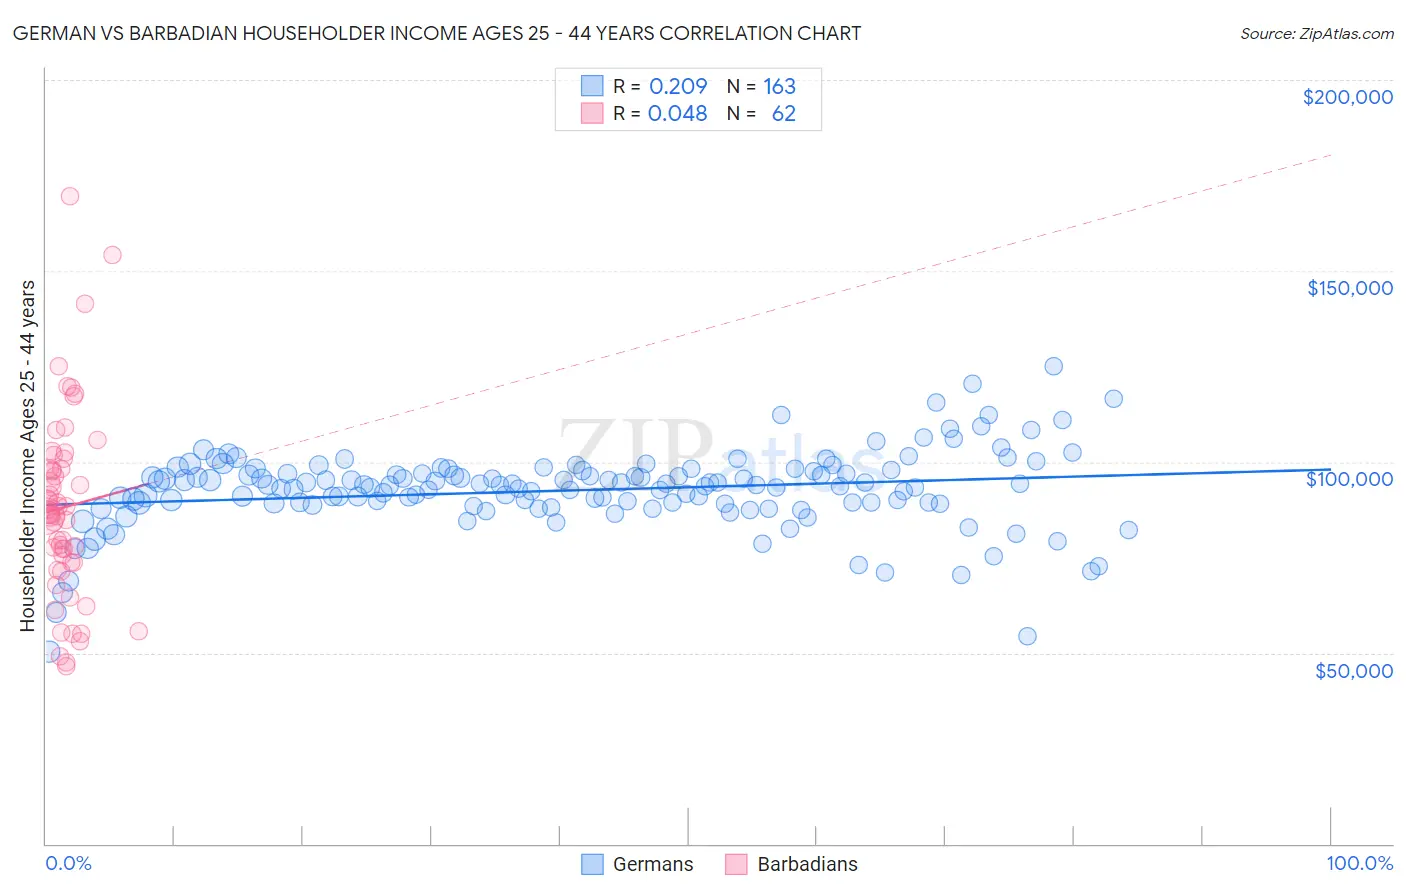
German vs Barbadian Householder Income Ages 25 - 44 years Correlation Chart
The statistical analysis conducted on geographies consisting of 573,342,679 people shows a weak positive correlation between the proportion of Germans and household income with householder between the ages 25 and 44 in the United States with a correlation coefficient (R) of 0.209 and weighted average of $93,531. Similarly, the statistical analysis conducted on geographies consisting of 141,212,757 people shows no correlation between the proportion of Barbadians and household income with householder between the ages 25 and 44 in the United States with a correlation coefficient (R) of 0.048 and weighted average of $89,565, a difference of 4.4%.
Householder Income Ages 25 - 44 years Correlation Summary
| Measurement | German | Barbadian |
| Minimum | $50,351 | $46,484 |
| Maximum | $125,193 | $169,656 |
| Range | $74,841 | $123,172 |
| Mean | $92,516 | $88,113 |
| Median | $93,847 | $86,577 |
| Interquartile 25% (IQ1) | $89,053 | $73,781 |
| Interquartile 75% (IQ3) | $97,570 | $98,316 |
| Interquartile Range (IQR) | $8,517 | $24,535 |
| Standard Deviation (Sample) | $10,480 | $24,335 |
| Standard Deviation (Population) | $10,448 | $24,138 |
Similar Demographics by Householder Income Ages 25 - 44 years
Demographics Similar to Germans by Householder Income Ages 25 - 44 years
In terms of householder income ages 25 - 44 years, the demographic groups most similar to Germans are Guamanian/Chamorro ($93,569, a difference of 0.040%), Immigrants from Eritrea ($93,466, a difference of 0.070%), Sierra Leonean ($93,435, a difference of 0.10%), Uruguayan ($93,631, a difference of 0.11%), and French ($93,665, a difference of 0.14%).
| Demographics | Rating | Rank | Householder Income Ages 25 - 44 years |
| Belgians | 45.8 /100 | #177 | Average $94,262 |
| Immigrants | South America | 42.8 /100 | #178 | Average $94,042 |
| French Canadians | 38.2 /100 | #179 | Fair $93,694 |
| French | 37.8 /100 | #180 | Fair $93,665 |
| Puget Sound Salish | 37.7 /100 | #181 | Fair $93,661 |
| Uruguayans | 37.3 /100 | #182 | Fair $93,631 |
| Guamanians/Chamorros | 36.5 /100 | #183 | Fair $93,569 |
| Germans | 36.0 /100 | #184 | Fair $93,531 |
| Immigrants | Eritrea | 35.2 /100 | #185 | Fair $93,466 |
| Sierra Leoneans | 34.8 /100 | #186 | Fair $93,435 |
| Spaniards | 34.0 /100 | #187 | Fair $93,366 |
| Immigrants | Sierra Leone | 30.9 /100 | #188 | Fair $93,115 |
| Dutch | 30.5 /100 | #189 | Fair $93,081 |
| Welsh | 30.0 /100 | #190 | Fair $93,039 |
| Tlingit-Haida | 29.4 /100 | #191 | Fair $92,987 |
Demographics Similar to Barbadians by Householder Income Ages 25 - 44 years
In terms of householder income ages 25 - 44 years, the demographic groups most similar to Barbadians are Immigrants from Guyana ($89,586, a difference of 0.020%), Immigrants from Ecuador ($89,673, a difference of 0.12%), Immigrants from Panama ($89,451, a difference of 0.13%), Immigrants from Iraq ($89,444, a difference of 0.14%), and Immigrants from Trinidad and Tobago ($89,748, a difference of 0.20%).
| Demographics | Rating | Rank | Householder Income Ages 25 - 44 years |
| Scotch-Irish | 7.3 /100 | #217 | Tragic $89,969 |
| Guyanese | 7.1 /100 | #218 | Tragic $89,940 |
| Delaware | 6.9 /100 | #219 | Tragic $89,876 |
| Trinidadians and Tobagonians | 6.8 /100 | #220 | Tragic $89,856 |
| Immigrants | Trinidad and Tobago | 6.5 /100 | #221 | Tragic $89,748 |
| Immigrants | Ecuador | 6.2 /100 | #222 | Tragic $89,673 |
| Immigrants | Guyana | 5.9 /100 | #223 | Tragic $89,586 |
| Barbadians | 5.9 /100 | #224 | Tragic $89,565 |
| Immigrants | Panama | 5.5 /100 | #225 | Tragic $89,451 |
| Immigrants | Iraq | 5.5 /100 | #226 | Tragic $89,444 |
| Immigrants | St. Vincent and the Grenadines | 4.1 /100 | #227 | Tragic $88,888 |
| Immigrants | Bosnia and Herzegovina | 4.0 /100 | #228 | Tragic $88,819 |
| Immigrants | Barbados | 3.7 /100 | #229 | Tragic $88,687 |
| Alaskan Athabascans | 3.3 /100 | #230 | Tragic $88,446 |
| Immigrants | Grenada | 3.0 /100 | #231 | Tragic $88,311 |