German vs Barbadian Unemployment Among Ages 55 to 59 years
COMPARE
German
Barbadian
Unemployment Among Ages 55 to 59 years
Unemployment Among Ages 55 to 59 years Comparison
Germans
Barbadians
4.5%
UNEMPLOYMENT AMONG AGES 55 TO 59 YEARS
99.9/ 100
METRIC RATING
31st/ 347
METRIC RANK
5.3%
UNEMPLOYMENT AMONG AGES 55 TO 59 YEARS
0.0/ 100
METRIC RATING
296th/ 347
METRIC RANK
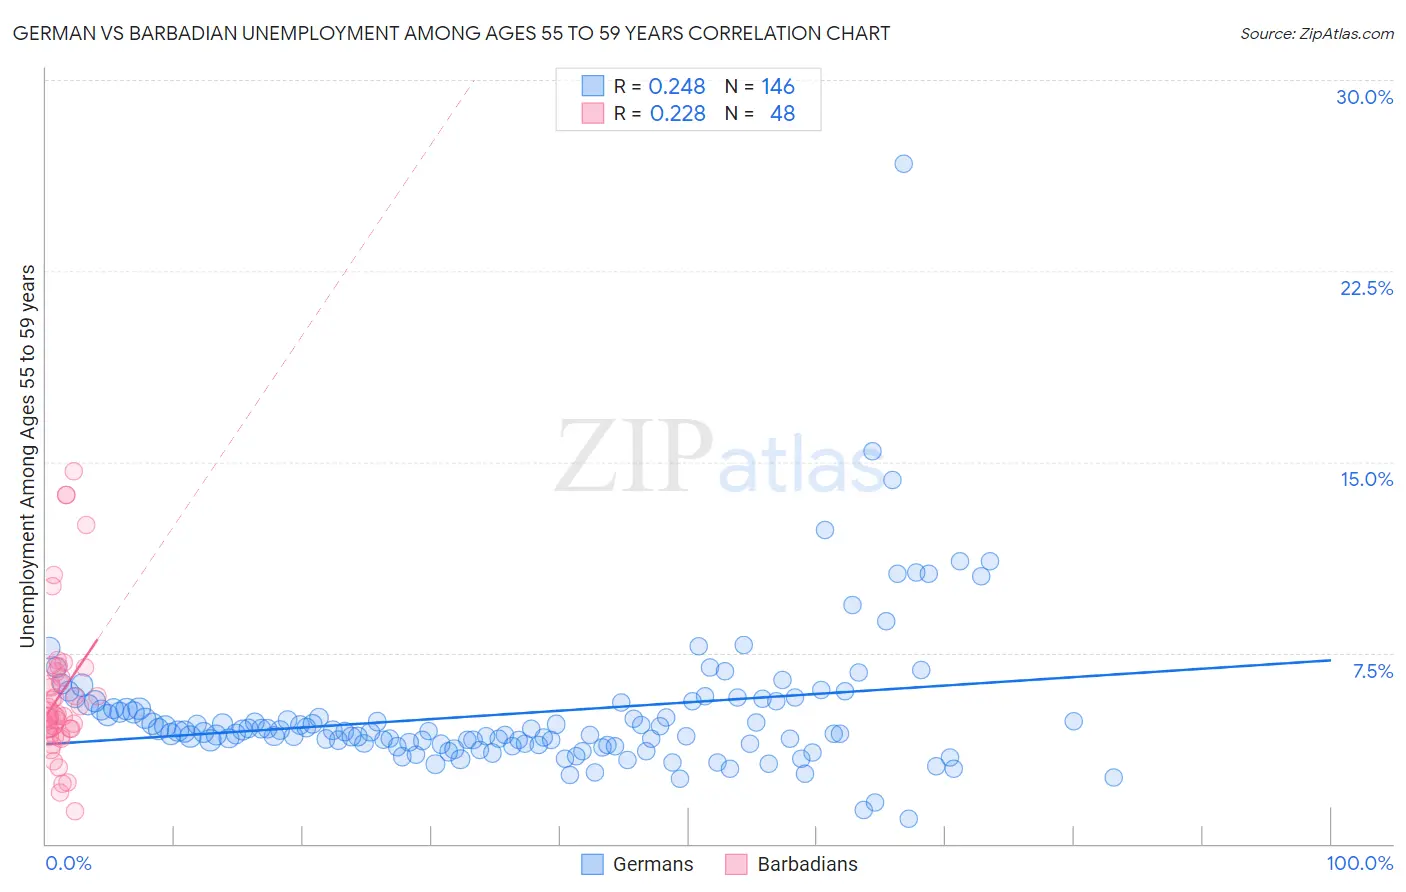
German vs Barbadian Unemployment Among Ages 55 to 59 years Correlation Chart
The statistical analysis conducted on geographies consisting of 490,019,759 people shows a weak positive correlation between the proportion of Germans and unemployment rate among population between the ages 55 and 59 in the United States with a correlation coefficient (R) of 0.248 and weighted average of 4.5%. Similarly, the statistical analysis conducted on geographies consisting of 137,668,651 people shows a weak positive correlation between the proportion of Barbadians and unemployment rate among population between the ages 55 and 59 in the United States with a correlation coefficient (R) of 0.228 and weighted average of 5.3%, a difference of 19.6%.
Unemployment Among Ages 55 to 59 years Correlation Summary
| Measurement | German | Barbadian |
| Minimum | 1.0% | 1.3% |
| Maximum | 26.7% | 14.6% |
| Range | 25.7% | 13.3% |
| Mean | 5.1% | 5.9% |
| Median | 4.4% | 5.0% |
| Interquartile 25% (IQ1) | 3.9% | 4.4% |
| Interquartile 75% (IQ3) | 5.3% | 6.6% |
| Interquartile Range (IQR) | 1.4% | 2.3% |
| Standard Deviation (Sample) | 2.8% | 2.9% |
| Standard Deviation (Population) | 2.8% | 2.9% |
Similar Demographics by Unemployment Among Ages 55 to 59 years
Demographics Similar to Germans by Unemployment Among Ages 55 to 59 years
In terms of unemployment among ages 55 to 59 years, the demographic groups most similar to Germans are Immigrants from Kenya (4.5%, a difference of 0.080%), Palestinian (4.5%, a difference of 0.10%), Immigrants from Eastern Africa (4.5%, a difference of 0.13%), Immigrants from Ethiopia (4.5%, a difference of 0.13%), and Immigrants from Zimbabwe (4.5%, a difference of 0.17%).
| Demographics | Rating | Rank | Unemployment Among Ages 55 to 59 years |
| Jordanians | 100.0 /100 | #24 | Exceptional 4.4% |
| Immigrants | Eritrea | 100.0 /100 | #25 | Exceptional 4.4% |
| Scandinavians | 99.9 /100 | #26 | Exceptional 4.5% |
| Immigrants | Zimbabwe | 99.9 /100 | #27 | Exceptional 4.5% |
| Immigrants | Eastern Africa | 99.9 /100 | #28 | Exceptional 4.5% |
| Palestinians | 99.9 /100 | #29 | Exceptional 4.5% |
| Immigrants | Kenya | 99.9 /100 | #30 | Exceptional 4.5% |
| Germans | 99.9 /100 | #31 | Exceptional 4.5% |
| Immigrants | Ethiopia | 99.9 /100 | #32 | Exceptional 4.5% |
| Belgians | 99.9 /100 | #33 | Exceptional 4.5% |
| Thais | 99.9 /100 | #34 | Exceptional 4.5% |
| Cypriots | 99.9 /100 | #35 | Exceptional 4.5% |
| Ethiopians | 99.9 /100 | #36 | Exceptional 4.5% |
| Immigrants | Bulgaria | 99.9 /100 | #37 | Exceptional 4.5% |
| Assyrians/Chaldeans/Syriacs | 99.9 /100 | #38 | Exceptional 4.5% |
Demographics Similar to Barbadians by Unemployment Among Ages 55 to 59 years
In terms of unemployment among ages 55 to 59 years, the demographic groups most similar to Barbadians are Dutch West Indian (5.3%, a difference of 0.040%), Cajun (5.3%, a difference of 0.16%), Immigrants from Mexico (5.3%, a difference of 0.22%), Immigrants from Grenada (5.3%, a difference of 0.28%), and British West Indian (5.3%, a difference of 0.47%).
| Demographics | Rating | Rank | Unemployment Among Ages 55 to 59 years |
| Immigrants | Central America | 0.0 /100 | #289 | Tragic 5.3% |
| Sioux | 0.0 /100 | #290 | Tragic 5.3% |
| Trinidadians and Tobagonians | 0.0 /100 | #291 | Tragic 5.3% |
| British West Indians | 0.0 /100 | #292 | Tragic 5.3% |
| Immigrants | Grenada | 0.0 /100 | #293 | Tragic 5.3% |
| Cajuns | 0.0 /100 | #294 | Tragic 5.3% |
| Dutch West Indians | 0.0 /100 | #295 | Tragic 5.3% |
| Barbadians | 0.0 /100 | #296 | Tragic 5.3% |
| Immigrants | Mexico | 0.0 /100 | #297 | Tragic 5.3% |
| Hispanics or Latinos | 0.0 /100 | #298 | Tragic 5.4% |
| Cape Verdeans | 0.0 /100 | #299 | Tragic 5.4% |
| Immigrants | St. Vincent and the Grenadines | 0.0 /100 | #300 | Tragic 5.4% |
| Immigrants | Dominica | 0.0 /100 | #301 | Tragic 5.5% |
| Sierra Leoneans | 0.0 /100 | #302 | Tragic 5.5% |
| Marshallese | 0.0 /100 | #303 | Tragic 5.5% |