Hungarian vs Barbadian 12th Grade, No Diploma
COMPARE
Hungarian
Barbadian
12th Grade, No Diploma
12th Grade, No Diploma Comparison
Hungarians
Barbadians
92.8%
12TH GRADE, NO DIPLOMA
99.7/ 100
METRIC RATING
54th/ 347
METRIC RANK
89.1%
12TH GRADE, NO DIPLOMA
0.1/ 100
METRIC RATING
273rd/ 347
METRIC RANK
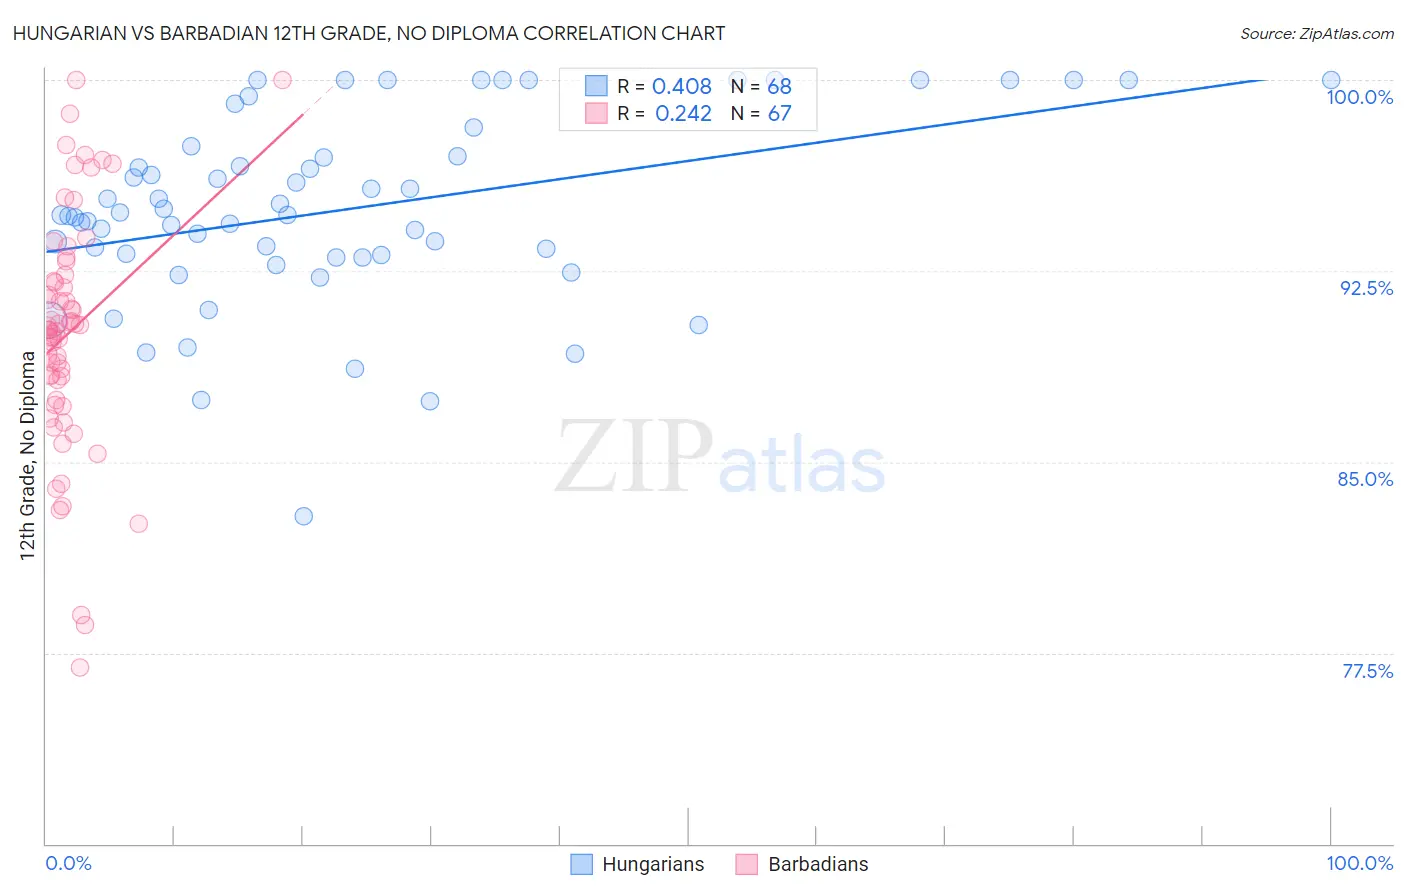
Hungarian vs Barbadian 12th Grade, No Diploma Correlation Chart
The statistical analysis conducted on geographies consisting of 486,240,766 people shows a moderate positive correlation between the proportion of Hungarians and percentage of population with at least 12th grade (no diploma) education in the United States with a correlation coefficient (R) of 0.408 and weighted average of 92.8%. Similarly, the statistical analysis conducted on geographies consisting of 141,304,590 people shows a weak positive correlation between the proportion of Barbadians and percentage of population with at least 12th grade (no diploma) education in the United States with a correlation coefficient (R) of 0.242 and weighted average of 89.1%, a difference of 4.2%.
12th Grade, No Diploma Correlation Summary
| Measurement | Hungarian | Barbadian |
| Minimum | 82.9% | 76.9% |
| Maximum | 100.0% | 100.0% |
| Range | 17.1% | 23.1% |
| Mean | 94.9% | 90.1% |
| Median | 94.7% | 90.2% |
| Interquartile 25% (IQ1) | 93.1% | 87.4% |
| Interquartile 75% (IQ3) | 97.2% | 92.3% |
| Interquartile Range (IQR) | 4.1% | 4.9% |
| Standard Deviation (Sample) | 3.7% | 4.7% |
| Standard Deviation (Population) | 3.7% | 4.7% |
Similar Demographics by 12th Grade, No Diploma
Demographics Similar to Hungarians by 12th Grade, No Diploma
In terms of 12th grade, no diploma, the demographic groups most similar to Hungarians are Serbian (92.8%, a difference of 0.0%), Welsh (92.8%, a difference of 0.0%), Immigrants from Sweden (92.8%, a difference of 0.010%), New Zealander (92.8%, a difference of 0.010%), and Tsimshian (92.9%, a difference of 0.030%).
| Demographics | Rating | Rank | 12th Grade, No Diploma |
| Belgians | 99.8 /100 | #47 | Exceptional 92.9% |
| Australians | 99.8 /100 | #48 | Exceptional 92.9% |
| Macedonians | 99.8 /100 | #49 | Exceptional 92.9% |
| Tsimshian | 99.8 /100 | #50 | Exceptional 92.9% |
| Immigrants | Belgium | 99.8 /100 | #51 | Exceptional 92.9% |
| Immigrants | Sweden | 99.8 /100 | #52 | Exceptional 92.8% |
| Serbians | 99.7 /100 | #53 | Exceptional 92.8% |
| Hungarians | 99.7 /100 | #54 | Exceptional 92.8% |
| Welsh | 99.7 /100 | #55 | Exceptional 92.8% |
| New Zealanders | 99.7 /100 | #56 | Exceptional 92.8% |
| Immigrants | Canada | 99.7 /100 | #57 | Exceptional 92.8% |
| Immigrants | Taiwan | 99.7 /100 | #58 | Exceptional 92.8% |
| Immigrants | North America | 99.7 /100 | #59 | Exceptional 92.8% |
| Slavs | 99.7 /100 | #60 | Exceptional 92.8% |
| Immigrants | Japan | 99.7 /100 | #61 | Exceptional 92.8% |
Demographics Similar to Barbadians by 12th Grade, No Diploma
In terms of 12th grade, no diploma, the demographic groups most similar to Barbadians are Cajun (89.1%, a difference of 0.020%), Immigrants from Congo (89.0%, a difference of 0.090%), Ute (89.0%, a difference of 0.090%), Malaysian (89.2%, a difference of 0.13%), and Bangladeshi (89.3%, a difference of 0.14%).
| Demographics | Rating | Rank | 12th Grade, No Diploma |
| Seminole | 0.2 /100 | #266 | Tragic 89.4% |
| West Indians | 0.2 /100 | #267 | Tragic 89.3% |
| Immigrants | Trinidad and Tobago | 0.1 /100 | #268 | Tragic 89.3% |
| U.S. Virgin Islanders | 0.1 /100 | #269 | Tragic 89.3% |
| Bangladeshis | 0.1 /100 | #270 | Tragic 89.3% |
| Blacks/African Americans | 0.1 /100 | #271 | Tragic 89.3% |
| Malaysians | 0.1 /100 | #272 | Tragic 89.2% |
| Barbadians | 0.1 /100 | #273 | Tragic 89.1% |
| Cajuns | 0.1 /100 | #274 | Tragic 89.1% |
| Immigrants | Congo | 0.1 /100 | #275 | Tragic 89.0% |
| Ute | 0.1 /100 | #276 | Tragic 89.0% |
| Immigrants | Barbados | 0.0 /100 | #277 | Tragic 89.0% |
| Immigrants | St. Vincent and the Grenadines | 0.0 /100 | #278 | Tragic 88.9% |
| Immigrants | Laos | 0.0 /100 | #279 | Tragic 88.9% |
| Immigrants | Burma/Myanmar | 0.0 /100 | #280 | Tragic 88.9% |