Iranian vs Barbadian 12th Grade, No Diploma
COMPARE
Iranian
Barbadian
12th Grade, No Diploma
12th Grade, No Diploma Comparison
Iranians
Barbadians
93.1%
12TH GRADE, NO DIPLOMA
99.9/ 100
METRIC RATING
29th/ 347
METRIC RANK
89.1%
12TH GRADE, NO DIPLOMA
0.1/ 100
METRIC RATING
273rd/ 347
METRIC RANK
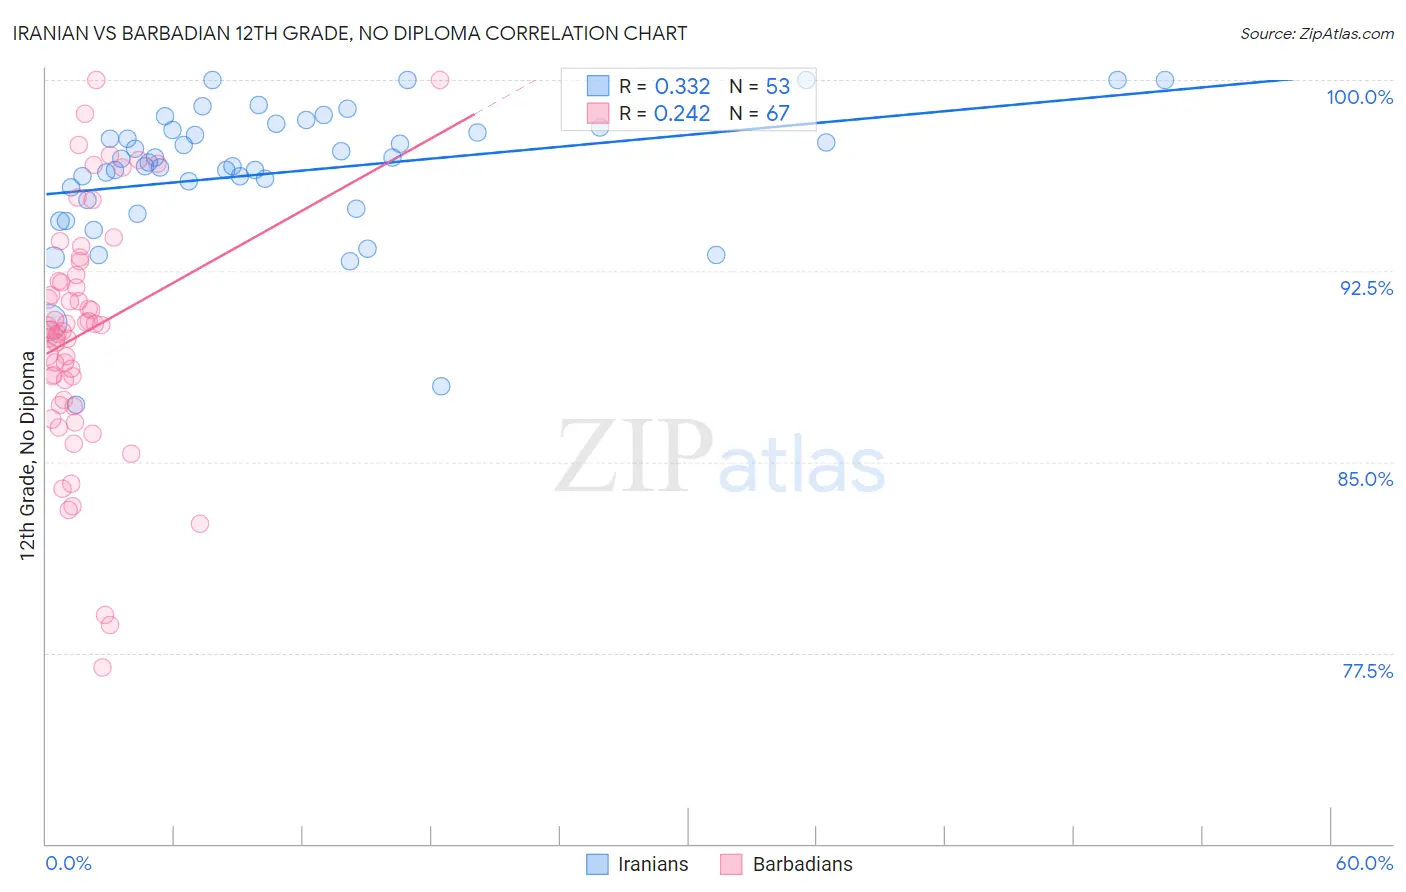
Iranian vs Barbadian 12th Grade, No Diploma Correlation Chart
The statistical analysis conducted on geographies consisting of 316,901,778 people shows a mild positive correlation between the proportion of Iranians and percentage of population with at least 12th grade (no diploma) education in the United States with a correlation coefficient (R) of 0.332 and weighted average of 93.1%. Similarly, the statistical analysis conducted on geographies consisting of 141,304,590 people shows a weak positive correlation between the proportion of Barbadians and percentage of population with at least 12th grade (no diploma) education in the United States with a correlation coefficient (R) of 0.242 and weighted average of 89.1%, a difference of 4.4%.
12th Grade, No Diploma Correlation Summary
| Measurement | Iranian | Barbadian |
| Minimum | 87.2% | 76.9% |
| Maximum | 100.0% | 100.0% |
| Range | 12.8% | 23.1% |
| Mean | 96.4% | 90.1% |
| Median | 96.7% | 90.2% |
| Interquartile 25% (IQ1) | 95.1% | 87.4% |
| Interquartile 75% (IQ3) | 98.1% | 92.3% |
| Interquartile Range (IQR) | 3.0% | 4.9% |
| Standard Deviation (Sample) | 2.7% | 4.7% |
| Standard Deviation (Population) | 2.7% | 4.7% |
Similar Demographics by 12th Grade, No Diploma
Demographics Similar to Iranians by 12th Grade, No Diploma
In terms of 12th grade, no diploma, the demographic groups most similar to Iranians are Immigrants from Lithuania (93.1%, a difference of 0.0%), Immigrants from Northern Europe (93.1%, a difference of 0.010%), Immigrants from Ireland (93.1%, a difference of 0.020%), European (93.1%, a difference of 0.030%), and Cypriot (93.1%, a difference of 0.050%).
| Demographics | Rating | Rank | 12th Grade, No Diploma |
| Estonians | 99.9 /100 | #22 | Exceptional 93.2% |
| Scandinavians | 99.9 /100 | #23 | Exceptional 93.2% |
| Thais | 99.9 /100 | #24 | Exceptional 93.2% |
| Czechs | 99.9 /100 | #25 | Exceptional 93.2% |
| Russians | 99.9 /100 | #26 | Exceptional 93.2% |
| Cypriots | 99.9 /100 | #27 | Exceptional 93.1% |
| Immigrants | Northern Europe | 99.9 /100 | #28 | Exceptional 93.1% |
| Iranians | 99.9 /100 | #29 | Exceptional 93.1% |
| Immigrants | Lithuania | 99.9 /100 | #30 | Exceptional 93.1% |
| Immigrants | Ireland | 99.9 /100 | #31 | Exceptional 93.1% |
| Europeans | 99.9 /100 | #32 | Exceptional 93.1% |
| Immigrants | Scotland | 99.9 /100 | #33 | Exceptional 93.0% |
| Okinawans | 99.9 /100 | #34 | Exceptional 93.0% |
| English | 99.9 /100 | #35 | Exceptional 93.0% |
| Scottish | 99.9 /100 | #36 | Exceptional 93.0% |
Demographics Similar to Barbadians by 12th Grade, No Diploma
In terms of 12th grade, no diploma, the demographic groups most similar to Barbadians are Cajun (89.1%, a difference of 0.020%), Immigrants from Congo (89.0%, a difference of 0.090%), Ute (89.0%, a difference of 0.090%), Malaysian (89.2%, a difference of 0.13%), and Bangladeshi (89.3%, a difference of 0.14%).
| Demographics | Rating | Rank | 12th Grade, No Diploma |
| Seminole | 0.2 /100 | #266 | Tragic 89.4% |
| West Indians | 0.2 /100 | #267 | Tragic 89.3% |
| Immigrants | Trinidad and Tobago | 0.1 /100 | #268 | Tragic 89.3% |
| U.S. Virgin Islanders | 0.1 /100 | #269 | Tragic 89.3% |
| Bangladeshis | 0.1 /100 | #270 | Tragic 89.3% |
| Blacks/African Americans | 0.1 /100 | #271 | Tragic 89.3% |
| Malaysians | 0.1 /100 | #272 | Tragic 89.2% |
| Barbadians | 0.1 /100 | #273 | Tragic 89.1% |
| Cajuns | 0.1 /100 | #274 | Tragic 89.1% |
| Immigrants | Congo | 0.1 /100 | #275 | Tragic 89.0% |
| Ute | 0.1 /100 | #276 | Tragic 89.0% |
| Immigrants | Barbados | 0.0 /100 | #277 | Tragic 89.0% |
| Immigrants | St. Vincent and the Grenadines | 0.0 /100 | #278 | Tragic 88.9% |
| Immigrants | Laos | 0.0 /100 | #279 | Tragic 88.9% |
| Immigrants | Burma/Myanmar | 0.0 /100 | #280 | Tragic 88.9% |