Brazilian vs French 9th Grade
COMPARE
Brazilian
French
9th Grade
9th Grade Comparison
Brazilians
French
94.9%
9TH GRADE
49.8/ 100
METRIC RATING
175th/ 347
METRIC RANK
96.3%
9TH GRADE
100.0/ 100
METRIC RATING
25th/ 347
METRIC RANK
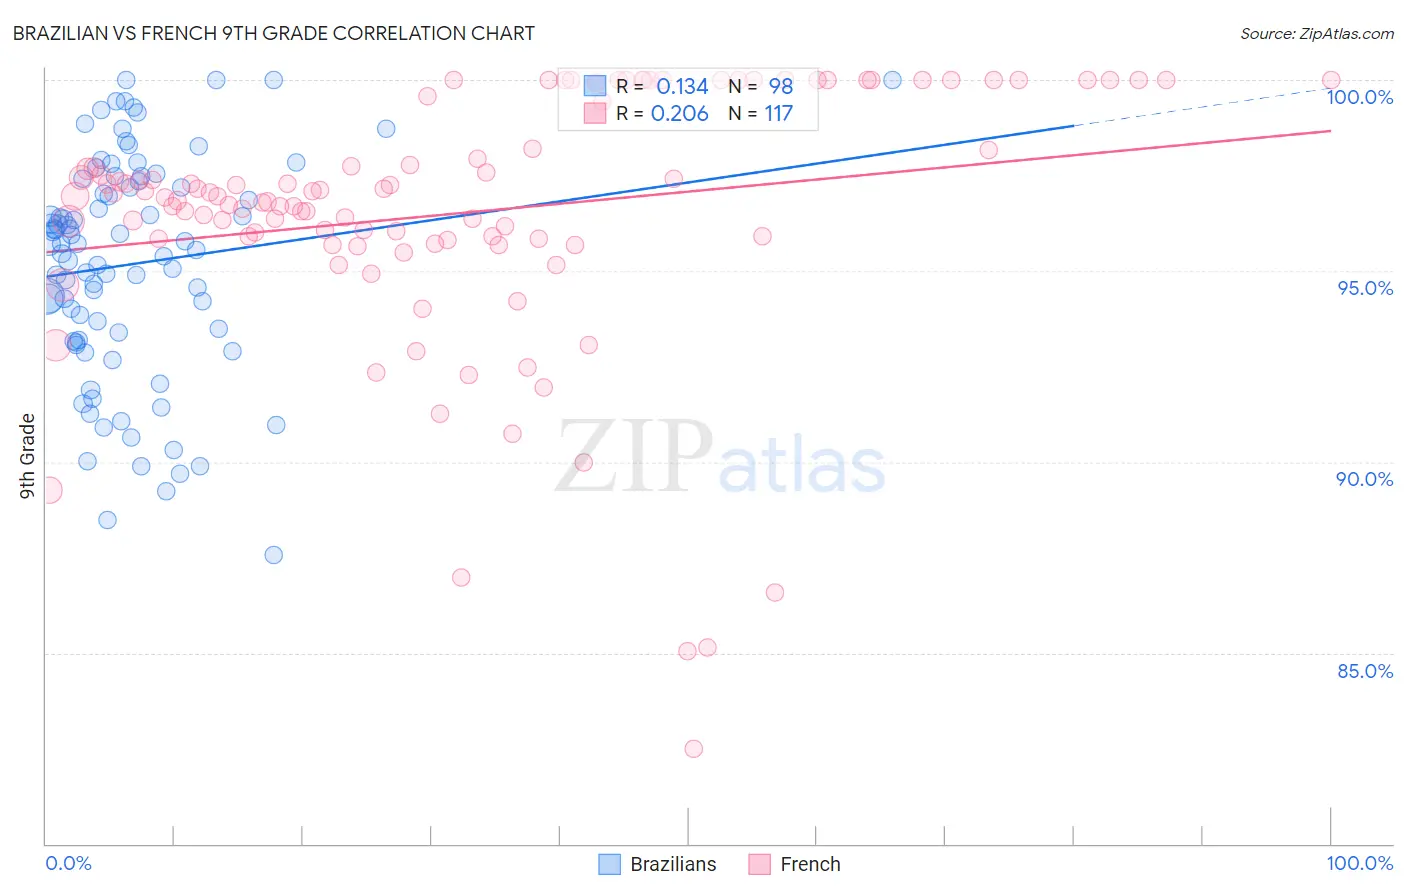
Brazilian vs French 9th Grade Correlation Chart
The statistical analysis conducted on geographies consisting of 323,900,771 people shows a poor positive correlation between the proportion of Brazilians and percentage of population with at least 9th grade education in the United States with a correlation coefficient (R) of 0.134 and weighted average of 94.9%. Similarly, the statistical analysis conducted on geographies consisting of 572,427,255 people shows a weak positive correlation between the proportion of French and percentage of population with at least 9th grade education in the United States with a correlation coefficient (R) of 0.206 and weighted average of 96.3%, a difference of 1.5%.
9th Grade Correlation Summary
| Measurement | Brazilian | French |
| Minimum | 87.6% | 82.5% |
| Maximum | 100.0% | 100.0% |
| Range | 12.4% | 17.5% |
| Mean | 95.2% | 96.5% |
| Median | 95.7% | 96.9% |
| Interquartile 25% (IQ1) | 93.2% | 95.8% |
| Interquartile 75% (IQ3) | 97.3% | 99.5% |
| Interquartile Range (IQR) | 4.1% | 3.7% |
| Standard Deviation (Sample) | 2.9% | 3.4% |
| Standard Deviation (Population) | 2.9% | 3.4% |
Similar Demographics by 9th Grade
Demographics Similar to Brazilians by 9th Grade
In terms of 9th grade, the demographic groups most similar to Brazilians are Immigrants from Egypt (94.9%, a difference of 0.0%), Cheyenne (94.9%, a difference of 0.010%), Immigrants from Spain (94.9%, a difference of 0.010%), Immigrants from Iraq (94.9%, a difference of 0.010%), and Immigrants from Poland (94.9%, a difference of 0.020%).
| Demographics | Rating | Rank | 9th Grade |
| Chileans | 60.7 /100 | #168 | Good 95.0% |
| Spaniards | 59.6 /100 | #169 | Average 94.9% |
| Alsatians | 58.6 /100 | #170 | Average 94.9% |
| Colville | 58.5 /100 | #171 | Average 94.9% |
| Iraqis | 54.0 /100 | #172 | Average 94.9% |
| Cheyenne | 51.5 /100 | #173 | Average 94.9% |
| Immigrants | Egypt | 50.0 /100 | #174 | Average 94.9% |
| Brazilians | 49.8 /100 | #175 | Average 94.9% |
| Immigrants | Spain | 49.1 /100 | #176 | Average 94.9% |
| Immigrants | Iraq | 47.8 /100 | #177 | Average 94.9% |
| Immigrants | Poland | 46.7 /100 | #178 | Average 94.9% |
| Immigrants | Venezuela | 46.5 /100 | #179 | Average 94.9% |
| Immigrants | Uganda | 43.1 /100 | #180 | Average 94.8% |
| Sierra Leoneans | 42.7 /100 | #181 | Average 94.8% |
| Seminole | 42.5 /100 | #182 | Average 94.8% |
Demographics Similar to French by 9th Grade
In terms of 9th grade, the demographic groups most similar to French are Latvian (96.4%, a difference of 0.010%), French Canadian (96.3%, a difference of 0.030%), Czech (96.4%, a difference of 0.040%), Scotch-Irish (96.3%, a difference of 0.040%), and Eastern European (96.3%, a difference of 0.040%).
| Demographics | Rating | Rank | 9th Grade |
| Scandinavians | 100.0 /100 | #18 | Exceptional 96.5% |
| Welsh | 100.0 /100 | #19 | Exceptional 96.4% |
| Italians | 100.0 /100 | #20 | Exceptional 96.4% |
| Alaskan Athabascans | 100.0 /100 | #21 | Exceptional 96.4% |
| Europeans | 100.0 /100 | #22 | Exceptional 96.4% |
| Czechs | 100.0 /100 | #23 | Exceptional 96.4% |
| Latvians | 100.0 /100 | #24 | Exceptional 96.4% |
| French | 100.0 /100 | #25 | Exceptional 96.3% |
| French Canadians | 100.0 /100 | #26 | Exceptional 96.3% |
| Scotch-Irish | 100.0 /100 | #27 | Exceptional 96.3% |
| Eastern Europeans | 100.0 /100 | #28 | Exceptional 96.3% |
| Chinese | 100.0 /100 | #29 | Exceptional 96.3% |
| Maltese | 100.0 /100 | #30 | Exceptional 96.3% |
| British | 100.0 /100 | #31 | Exceptional 96.3% |
| Belgians | 100.0 /100 | #32 | Exceptional 96.3% |