Immigrants from Guatemala vs French 9th Grade
COMPARE
Immigrants from Guatemala
French
9th Grade
9th Grade Comparison
Immigrants from Guatemala
French
89.4%
9TH GRADE
0.0/ 100
METRIC RATING
343rd/ 347
METRIC RANK
96.3%
9TH GRADE
100.0/ 100
METRIC RATING
25th/ 347
METRIC RANK
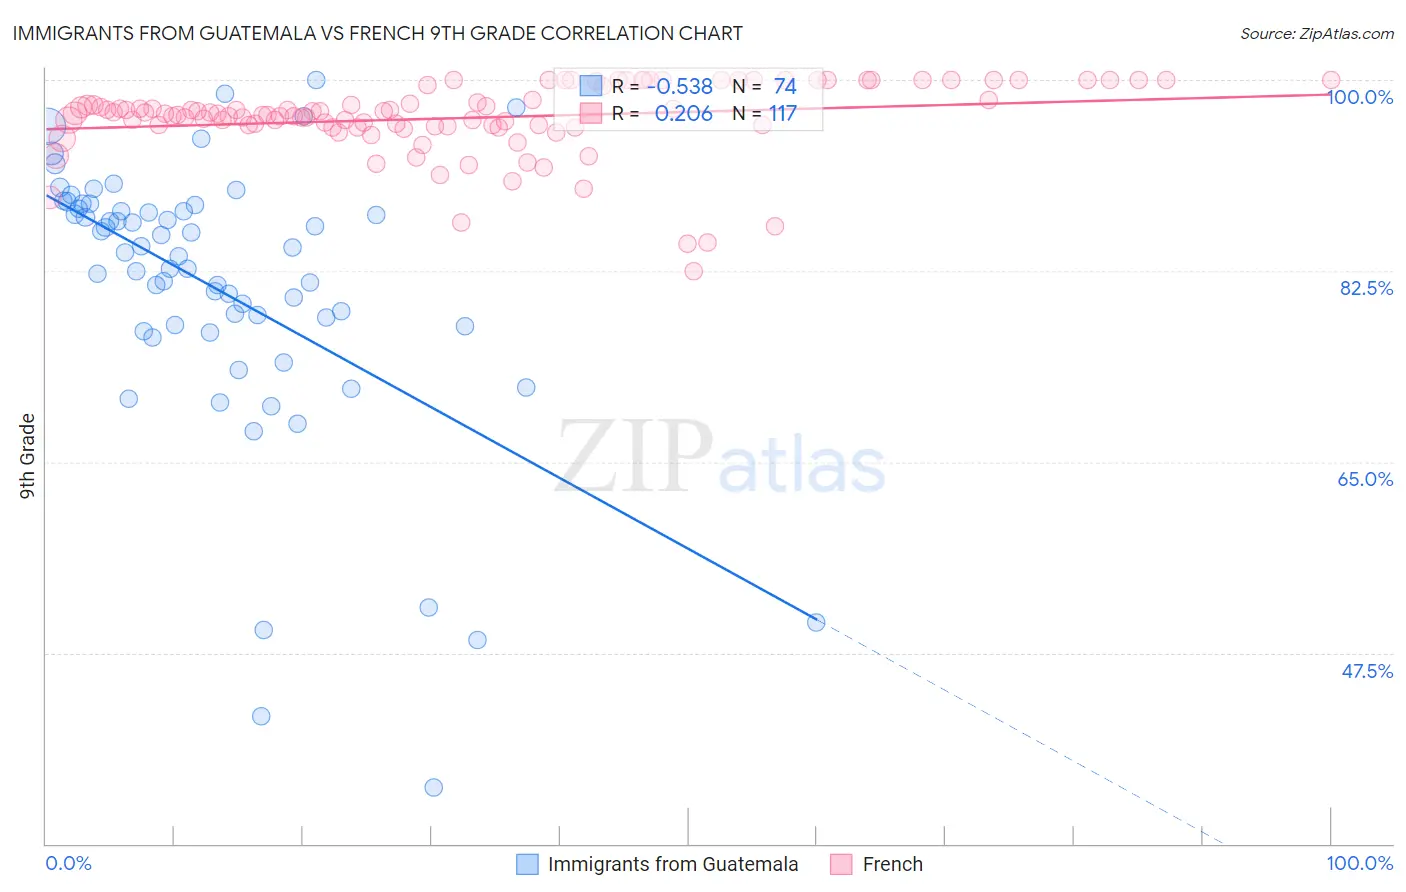
Immigrants from Guatemala vs French 9th Grade Correlation Chart
The statistical analysis conducted on geographies consisting of 377,286,142 people shows a substantial negative correlation between the proportion of Immigrants from Guatemala and percentage of population with at least 9th grade education in the United States with a correlation coefficient (R) of -0.538 and weighted average of 89.4%. Similarly, the statistical analysis conducted on geographies consisting of 572,427,255 people shows a weak positive correlation between the proportion of French and percentage of population with at least 9th grade education in the United States with a correlation coefficient (R) of 0.206 and weighted average of 96.3%, a difference of 7.7%.
9th Grade Correlation Summary
| Measurement | Immigrants from Guatemala | French |
| Minimum | 35.2% | 82.5% |
| Maximum | 100.0% | 100.0% |
| Range | 64.8% | 17.5% |
| Mean | 80.9% | 96.5% |
| Median | 84.1% | 96.9% |
| Interquartile 25% (IQ1) | 77.5% | 95.8% |
| Interquartile 75% (IQ3) | 88.2% | 99.5% |
| Interquartile Range (IQR) | 10.7% | 3.7% |
| Standard Deviation (Sample) | 12.7% | 3.4% |
| Standard Deviation (Population) | 12.6% | 3.4% |
Similar Demographics by 9th Grade
Demographics Similar to Immigrants from Guatemala by 9th Grade
In terms of 9th grade, the demographic groups most similar to Immigrants from Guatemala are Salvadoran (89.6%, a difference of 0.20%), Guatemalan (89.9%, a difference of 0.51%), Immigrants from El Salvador (89.0%, a difference of 0.51%), Immigrants from Central America (89.0%, a difference of 0.53%), and Mexican (90.0%, a difference of 0.63%).
| Demographics | Rating | Rank | 9th Grade |
| Immigrants | Yemen | 0.0 /100 | #333 | Tragic 90.8% |
| Immigrants | Azores | 0.0 /100 | #334 | Tragic 90.8% |
| Immigrants | Honduras | 0.0 /100 | #335 | Tragic 90.6% |
| Immigrants | Dominican Republic | 0.0 /100 | #336 | Tragic 90.5% |
| Immigrants | Latin America | 0.0 /100 | #337 | Tragic 90.4% |
| Central Americans | 0.0 /100 | #338 | Tragic 90.4% |
| Yakama | 0.0 /100 | #339 | Tragic 90.1% |
| Mexicans | 0.0 /100 | #340 | Tragic 90.0% |
| Guatemalans | 0.0 /100 | #341 | Tragic 89.9% |
| Salvadorans | 0.0 /100 | #342 | Tragic 89.6% |
| Immigrants | Guatemala | 0.0 /100 | #343 | Tragic 89.4% |
| Immigrants | El Salvador | 0.0 /100 | #344 | Tragic 89.0% |
| Immigrants | Central America | 0.0 /100 | #345 | Tragic 89.0% |
| Immigrants | Mexico | 0.0 /100 | #346 | Tragic 88.7% |
| Spanish American Indians | 0.0 /100 | #347 | Tragic 88.3% |
Demographics Similar to French by 9th Grade
In terms of 9th grade, the demographic groups most similar to French are Latvian (96.4%, a difference of 0.010%), French Canadian (96.3%, a difference of 0.030%), Czech (96.4%, a difference of 0.040%), Scotch-Irish (96.3%, a difference of 0.040%), and Eastern European (96.3%, a difference of 0.040%).
| Demographics | Rating | Rank | 9th Grade |
| Scandinavians | 100.0 /100 | #18 | Exceptional 96.5% |
| Welsh | 100.0 /100 | #19 | Exceptional 96.4% |
| Italians | 100.0 /100 | #20 | Exceptional 96.4% |
| Alaskan Athabascans | 100.0 /100 | #21 | Exceptional 96.4% |
| Europeans | 100.0 /100 | #22 | Exceptional 96.4% |
| Czechs | 100.0 /100 | #23 | Exceptional 96.4% |
| Latvians | 100.0 /100 | #24 | Exceptional 96.4% |
| French | 100.0 /100 | #25 | Exceptional 96.3% |
| French Canadians | 100.0 /100 | #26 | Exceptional 96.3% |
| Scotch-Irish | 100.0 /100 | #27 | Exceptional 96.3% |
| Eastern Europeans | 100.0 /100 | #28 | Exceptional 96.3% |
| Chinese | 100.0 /100 | #29 | Exceptional 96.3% |
| Maltese | 100.0 /100 | #30 | Exceptional 96.3% |
| British | 100.0 /100 | #31 | Exceptional 96.3% |
| Belgians | 100.0 /100 | #32 | Exceptional 96.3% |