Immigrants from Italy vs Salvadoran Master's Degree
COMPARE
Immigrants from Italy
Salvadoran
Master's Degree
Master's Degree Comparison
Immigrants from Italy
Salvadorans
17.2%
MASTER'S DEGREE
99.1/ 100
METRIC RATING
93rd/ 347
METRIC RANK
12.2%
MASTER'S DEGREE
0.3/ 100
METRIC RATING
270th/ 347
METRIC RANK
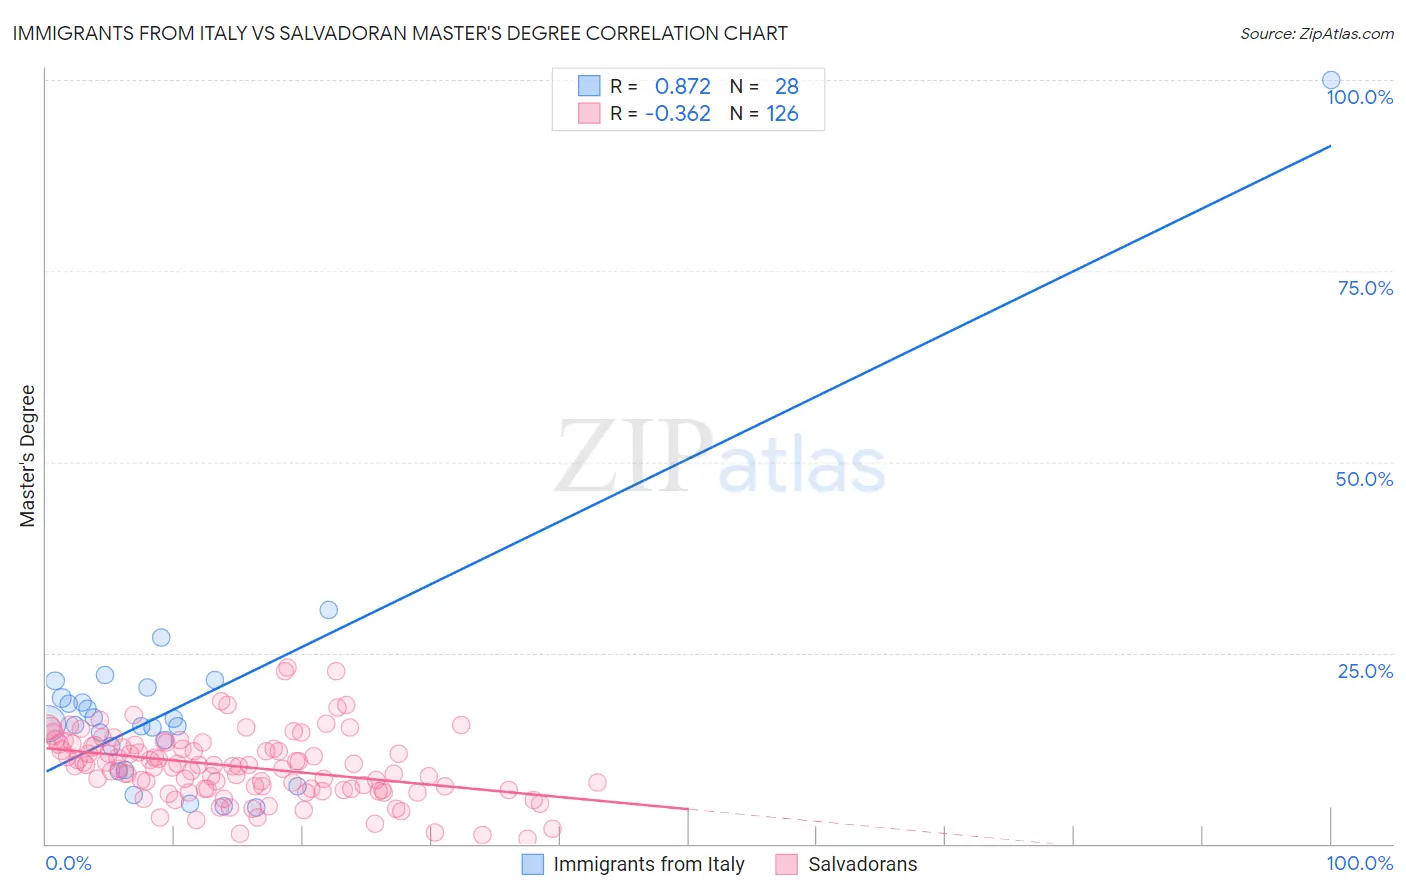
Immigrants from Italy vs Salvadoran Master's Degree Correlation Chart
The statistical analysis conducted on geographies consisting of 324,197,750 people shows a very strong positive correlation between the proportion of Immigrants from Italy and percentage of population with at least master's degree education in the United States with a correlation coefficient (R) of 0.872 and weighted average of 17.2%. Similarly, the statistical analysis conducted on geographies consisting of 398,764,232 people shows a mild negative correlation between the proportion of Salvadorans and percentage of population with at least master's degree education in the United States with a correlation coefficient (R) of -0.362 and weighted average of 12.2%, a difference of 40.9%.
Master's Degree Correlation Summary
| Measurement | Immigrants from Italy | Salvadoran |
| Minimum | 4.8% | 0.69% |
| Maximum | 100.0% | 23.0% |
| Range | 95.2% | 22.3% |
| Mean | 18.4% | 10.1% |
| Median | 15.6% | 10.2% |
| Interquartile 25% (IQ1) | 11.2% | 7.1% |
| Interquartile 75% (IQ3) | 19.7% | 12.9% |
| Interquartile Range (IQR) | 8.5% | 5.7% |
| Standard Deviation (Sample) | 17.2% | 4.4% |
| Standard Deviation (Population) | 16.9% | 4.4% |
Similar Demographics by Master's Degree
Demographics Similar to Immigrants from Italy by Master's Degree
In terms of master's degree, the demographic groups most similar to Immigrants from Italy are Immigrants from North America (17.2%, a difference of 0.060%), Romanian (17.2%, a difference of 0.11%), Ugandan (17.1%, a difference of 0.13%), Immigrants from Egypt (17.2%, a difference of 0.18%), and Bhutanese (17.2%, a difference of 0.20%).
| Demographics | Rating | Rank | Master's Degree |
| Immigrants | Croatia | 99.3 /100 | #86 | Exceptional 17.3% |
| Maltese | 99.3 /100 | #87 | Exceptional 17.3% |
| Immigrants | Canada | 99.2 /100 | #88 | Exceptional 17.2% |
| Bhutanese | 99.1 /100 | #89 | Exceptional 17.2% |
| Immigrants | Egypt | 99.1 /100 | #90 | Exceptional 17.2% |
| Romanians | 99.1 /100 | #91 | Exceptional 17.2% |
| Immigrants | North America | 99.1 /100 | #92 | Exceptional 17.2% |
| Immigrants | Italy | 99.1 /100 | #93 | Exceptional 17.2% |
| Ugandans | 99.0 /100 | #94 | Exceptional 17.1% |
| Immigrants | Morocco | 98.9 /100 | #95 | Exceptional 17.1% |
| Immigrants | Northern Africa | 98.9 /100 | #96 | Exceptional 17.1% |
| Immigrants | England | 98.8 /100 | #97 | Exceptional 17.0% |
| Immigrants | Ukraine | 98.8 /100 | #98 | Exceptional 17.0% |
| Laotians | 98.8 /100 | #99 | Exceptional 17.0% |
| Albanians | 98.7 /100 | #100 | Exceptional 17.0% |
Demographics Similar to Salvadorans by Master's Degree
In terms of master's degree, the demographic groups most similar to Salvadorans are Central American (12.2%, a difference of 0.13%), Haitian (12.1%, a difference of 0.59%), Comanche (12.1%, a difference of 0.64%), Blackfeet (12.1%, a difference of 0.74%), and Native Hawaiian (12.3%, a difference of 0.78%).
| Demographics | Rating | Rank | Master's Degree |
| Central American Indians | 0.5 /100 | #263 | Tragic 12.4% |
| Belizeans | 0.5 /100 | #264 | Tragic 12.4% |
| Immigrants | Fiji | 0.5 /100 | #265 | Tragic 12.4% |
| Bahamians | 0.5 /100 | #266 | Tragic 12.4% |
| Americans | 0.4 /100 | #267 | Tragic 12.3% |
| Native Hawaiians | 0.4 /100 | #268 | Tragic 12.3% |
| Central Americans | 0.3 /100 | #269 | Tragic 12.2% |
| Salvadorans | 0.3 /100 | #270 | Tragic 12.2% |
| Haitians | 0.3 /100 | #271 | Tragic 12.1% |
| Comanche | 0.3 /100 | #272 | Tragic 12.1% |
| Blackfeet | 0.3 /100 | #273 | Tragic 12.1% |
| Cape Verdeans | 0.3 /100 | #274 | Tragic 12.1% |
| Cubans | 0.3 /100 | #275 | Tragic 12.1% |
| Blacks/African Americans | 0.3 /100 | #276 | Tragic 12.1% |
| Immigrants | Caribbean | 0.3 /100 | #277 | Tragic 12.1% |