French Canadian vs Immigrants from Moldova Professional Degree
COMPARE
French Canadian
Immigrants from Moldova
Professional Degree
Professional Degree Comparison
French Canadians
Immigrants from Moldova
4.0%
PROFESSIONAL DEGREE
8.0/ 100
METRIC RATING
221st/ 347
METRIC RANK
4.9%
PROFESSIONAL DEGREE
94.8/ 100
METRIC RATING
121st/ 347
METRIC RANK
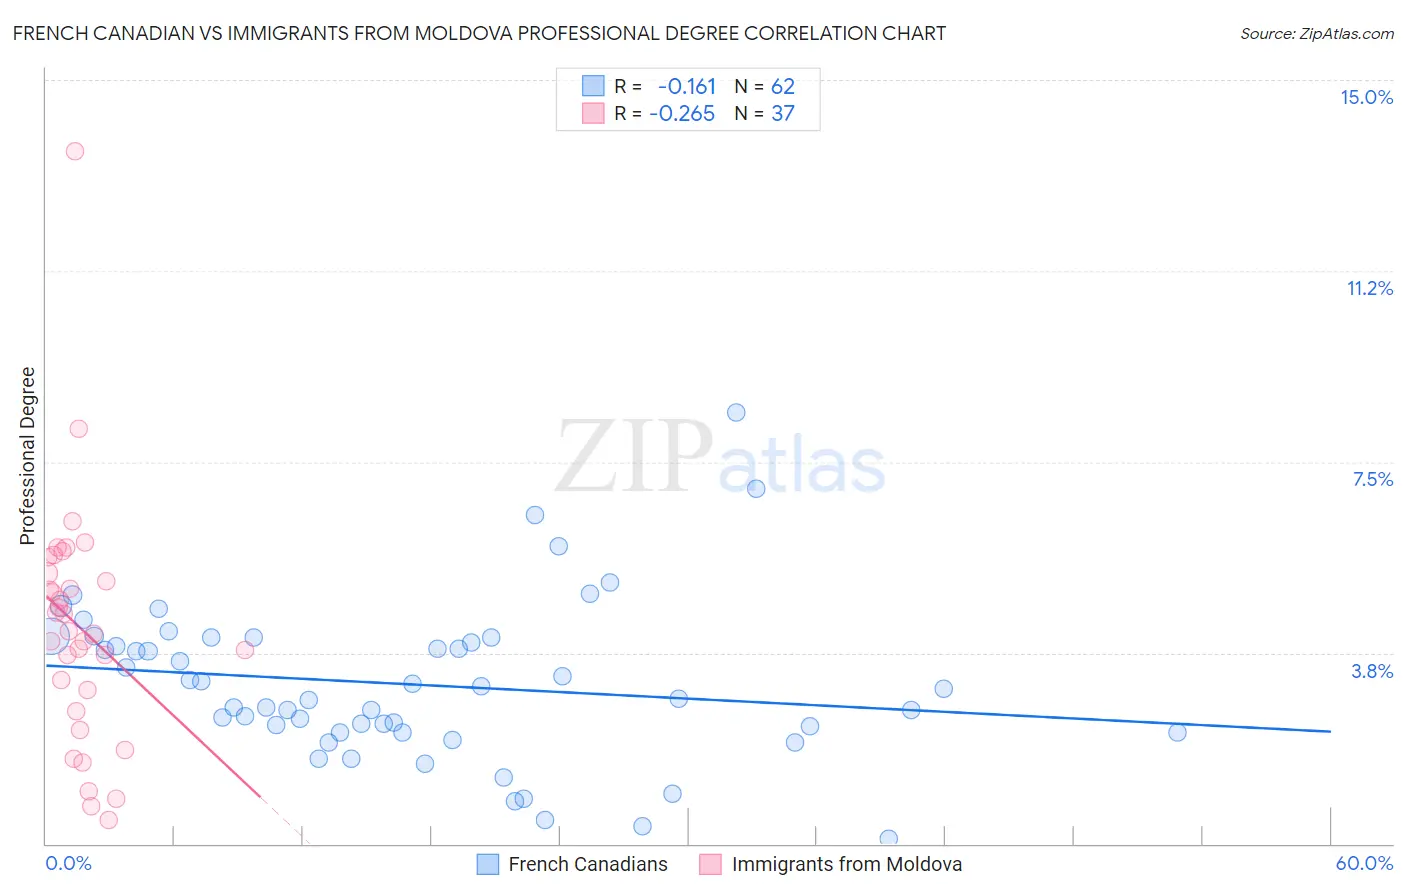
French Canadian vs Immigrants from Moldova Professional Degree Correlation Chart
The statistical analysis conducted on geographies consisting of 499,387,029 people shows a poor negative correlation between the proportion of French Canadians and percentage of population with at least professional degree education in the United States with a correlation coefficient (R) of -0.161 and weighted average of 4.0%. Similarly, the statistical analysis conducted on geographies consisting of 124,337,930 people shows a weak negative correlation between the proportion of Immigrants from Moldova and percentage of population with at least professional degree education in the United States with a correlation coefficient (R) of -0.265 and weighted average of 4.9%, a difference of 21.4%.
Professional Degree Correlation Summary
| Measurement | French Canadian | Immigrants from Moldova |
| Minimum | 0.11% | 0.45% |
| Maximum | 8.5% | 13.6% |
| Range | 8.4% | 13.1% |
| Mean | 3.1% | 4.2% |
| Median | 3.0% | 4.2% |
| Interquartile 25% (IQ1) | 2.2% | 2.8% |
| Interquartile 75% (IQ3) | 4.0% | 5.5% |
| Interquartile Range (IQR) | 1.8% | 2.7% |
| Standard Deviation (Sample) | 1.6% | 2.4% |
| Standard Deviation (Population) | 1.5% | 2.3% |
Similar Demographics by Professional Degree
Demographics Similar to French Canadians by Professional Degree
In terms of professional degree, the demographic groups most similar to French Canadians are Ute (4.0%, a difference of 0.13%), Immigrants from Western Africa (4.0%, a difference of 0.25%), Immigrants from Bosnia and Herzegovina (4.0%, a difference of 0.33%), Trinidadian and Tobagonian (4.0%, a difference of 0.47%), and Immigrants from South Eastern Asia (4.0%, a difference of 0.49%).
| Demographics | Rating | Rank | Professional Degree |
| Immigrants | Ghana | 10.6 /100 | #214 | Poor 4.1% |
| Portuguese | 10.5 /100 | #215 | Poor 4.1% |
| West Indians | 9.8 /100 | #216 | Tragic 4.1% |
| Immigrants | Vietnam | 9.4 /100 | #217 | Tragic 4.0% |
| Dutch | 9.0 /100 | #218 | Tragic 4.0% |
| Immigrants | South Eastern Asia | 8.9 /100 | #219 | Tragic 4.0% |
| Ute | 8.2 /100 | #220 | Tragic 4.0% |
| French Canadians | 8.0 /100 | #221 | Tragic 4.0% |
| Immigrants | Western Africa | 7.5 /100 | #222 | Tragic 4.0% |
| Immigrants | Bosnia and Herzegovina | 7.4 /100 | #223 | Tragic 4.0% |
| Trinidadians and Tobagonians | 7.1 /100 | #224 | Tragic 4.0% |
| Tlingit-Haida | 6.9 /100 | #225 | Tragic 4.0% |
| German Russians | 6.1 /100 | #226 | Tragic 4.0% |
| Cubans | 5.9 /100 | #227 | Tragic 4.0% |
| Immigrants | West Indies | 5.6 /100 | #228 | Tragic 4.0% |
Demographics Similar to Immigrants from Moldova by Professional Degree
In terms of professional degree, the demographic groups most similar to Immigrants from Moldova are Albanian (4.9%, a difference of 0.35%), Immigrants from Sudan (4.9%, a difference of 0.36%), Immigrants from Germany (4.9%, a difference of 0.46%), Immigrants from Venezuela (4.8%, a difference of 0.63%), and Immigrants from Eritrea (4.8%, a difference of 0.82%).
| Demographics | Rating | Rank | Professional Degree |
| Immigrants | Morocco | 96.8 /100 | #114 | Exceptional 5.0% |
| Moroccans | 96.8 /100 | #115 | Exceptional 5.0% |
| Venezuelans | 96.3 /100 | #116 | Exceptional 4.9% |
| Immigrants | Syria | 96.0 /100 | #117 | Exceptional 4.9% |
| Croatians | 96.0 /100 | #118 | Exceptional 4.9% |
| Immigrants | Sudan | 95.4 /100 | #119 | Exceptional 4.9% |
| Albanians | 95.3 /100 | #120 | Exceptional 4.9% |
| Immigrants | Moldova | 94.8 /100 | #121 | Exceptional 4.9% |
| Immigrants | Germany | 94.1 /100 | #122 | Exceptional 4.9% |
| Immigrants | Venezuela | 93.8 /100 | #123 | Exceptional 4.8% |
| Immigrants | Eritrea | 93.5 /100 | #124 | Exceptional 4.8% |
| Immigrants | Albania | 93.3 /100 | #125 | Exceptional 4.8% |
| Europeans | 93.2 /100 | #126 | Exceptional 4.8% |
| Serbians | 92.6 /100 | #127 | Exceptional 4.8% |
| Immigrants | Eastern Africa | 92.5 /100 | #128 | Exceptional 4.8% |