Creek vs Mexican American Indian 11th Grade
COMPARE
Creek
Mexican American Indian
11th Grade
11th Grade Comparison
Creek
Mexican American Indians
92.4%
11TH GRADE
40.9/ 100
METRIC RATING
179th/ 347
METRIC RANK
87.5%
11TH GRADE
0.0/ 100
METRIC RATING
329th/ 347
METRIC RANK
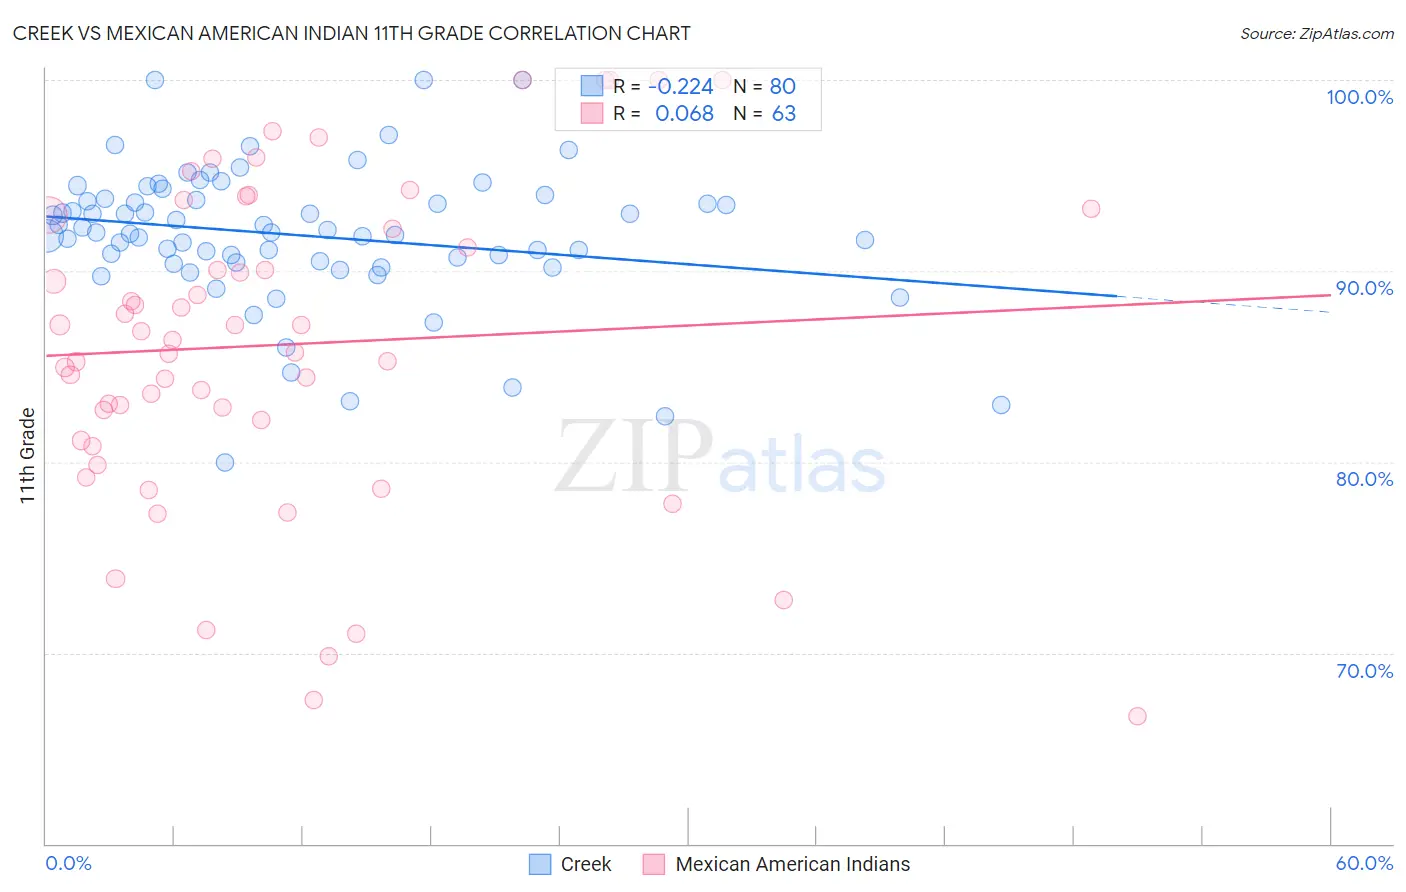
Creek vs Mexican American Indian 11th Grade Correlation Chart
The statistical analysis conducted on geographies consisting of 178,480,629 people shows a weak negative correlation between the proportion of Creek and percentage of population with at least 11th grade education in the United States with a correlation coefficient (R) of -0.224 and weighted average of 92.4%. Similarly, the statistical analysis conducted on geographies consisting of 317,621,155 people shows a slight positive correlation between the proportion of Mexican American Indians and percentage of population with at least 11th grade education in the United States with a correlation coefficient (R) of 0.068 and weighted average of 87.5%, a difference of 5.6%.
11th Grade Correlation Summary
| Measurement | Creek | Mexican American Indian |
| Minimum | 80.0% | 66.7% |
| Maximum | 100.0% | 100.0% |
| Range | 20.0% | 33.3% |
| Mean | 91.9% | 86.1% |
| Median | 92.0% | 86.4% |
| Interquartile 25% (IQ1) | 90.5% | 81.1% |
| Interquartile 75% (IQ3) | 93.8% | 93.0% |
| Interquartile Range (IQR) | 3.3% | 11.8% |
| Standard Deviation (Sample) | 3.7% | 8.3% |
| Standard Deviation (Population) | 3.7% | 8.3% |
Similar Demographics by 11th Grade
Demographics Similar to Creek by 11th Grade
In terms of 11th grade, the demographic groups most similar to Creek are Inupiat (92.4%, a difference of 0.0%), Cherokee (92.4%, a difference of 0.0%), Sudanese (92.5%, a difference of 0.020%), Immigrants from Morocco (92.4%, a difference of 0.020%), and Immigrants from Malaysia (92.4%, a difference of 0.030%).
| Demographics | Rating | Rank | 11th Grade |
| Immigrants | Pakistan | 52.3 /100 | #172 | Average 92.5% |
| Indians (Asian) | 51.5 /100 | #173 | Average 92.5% |
| Asians | 50.0 /100 | #174 | Average 92.5% |
| Shoshone | 48.9 /100 | #175 | Average 92.5% |
| Spaniards | 46.9 /100 | #176 | Average 92.5% |
| Guamanians/Chamorros | 45.0 /100 | #177 | Average 92.5% |
| Sudanese | 43.4 /100 | #178 | Average 92.5% |
| Creek | 40.9 /100 | #179 | Average 92.4% |
| Inupiat | 40.7 /100 | #180 | Average 92.4% |
| Cherokee | 40.7 /100 | #181 | Average 92.4% |
| Immigrants | Morocco | 38.6 /100 | #182 | Fair 92.4% |
| Immigrants | Malaysia | 37.6 /100 | #183 | Fair 92.4% |
| Immigrants | Asia | 37.4 /100 | #184 | Fair 92.4% |
| Immigrants | Nepal | 36.4 /100 | #185 | Fair 92.4% |
| Arapaho | 35.1 /100 | #186 | Fair 92.4% |
Demographics Similar to Mexican American Indians by 11th Grade
In terms of 11th grade, the demographic groups most similar to Mexican American Indians are Tohono O'odham (87.6%, a difference of 0.070%), Immigrants from Cabo Verde (87.6%, a difference of 0.13%), Dominican (87.7%, a difference of 0.15%), Honduran (87.4%, a difference of 0.19%), and Hispanic or Latino (87.3%, a difference of 0.25%).
| Demographics | Rating | Rank | 11th Grade |
| Puerto Ricans | 0.0 /100 | #322 | Tragic 88.4% |
| Pima | 0.0 /100 | #323 | Tragic 88.3% |
| Central American Indians | 0.0 /100 | #324 | Tragic 88.2% |
| Immigrants | Nicaragua | 0.0 /100 | #325 | Tragic 88.1% |
| Dominicans | 0.0 /100 | #326 | Tragic 87.7% |
| Immigrants | Cabo Verde | 0.0 /100 | #327 | Tragic 87.6% |
| Tohono O'odham | 0.0 /100 | #328 | Tragic 87.6% |
| Mexican American Indians | 0.0 /100 | #329 | Tragic 87.5% |
| Hondurans | 0.0 /100 | #330 | Tragic 87.4% |
| Hispanics or Latinos | 0.0 /100 | #331 | Tragic 87.3% |
| Immigrants | Azores | 0.0 /100 | #332 | Tragic 87.2% |
| Immigrants | Yemen | 0.0 /100 | #333 | Tragic 87.1% |
| Houma | 0.0 /100 | #334 | Tragic 87.0% |
| Central Americans | 0.0 /100 | #335 | Tragic 86.9% |
| Immigrants | Dominican Republic | 0.0 /100 | #336 | Tragic 86.9% |