Czech vs Immigrants from Fiji High School Diploma
COMPARE
Czech
Immigrants from Fiji
High School Diploma
High School Diploma Comparison
Czechs
Immigrants from Fiji
91.6%
HIGH SCHOOL DIPLOMA
99.9/ 100
METRIC RATING
20th/ 347
METRIC RANK
85.8%
HIGH SCHOOL DIPLOMA
0.0/ 100
METRIC RATING
294th/ 347
METRIC RANK
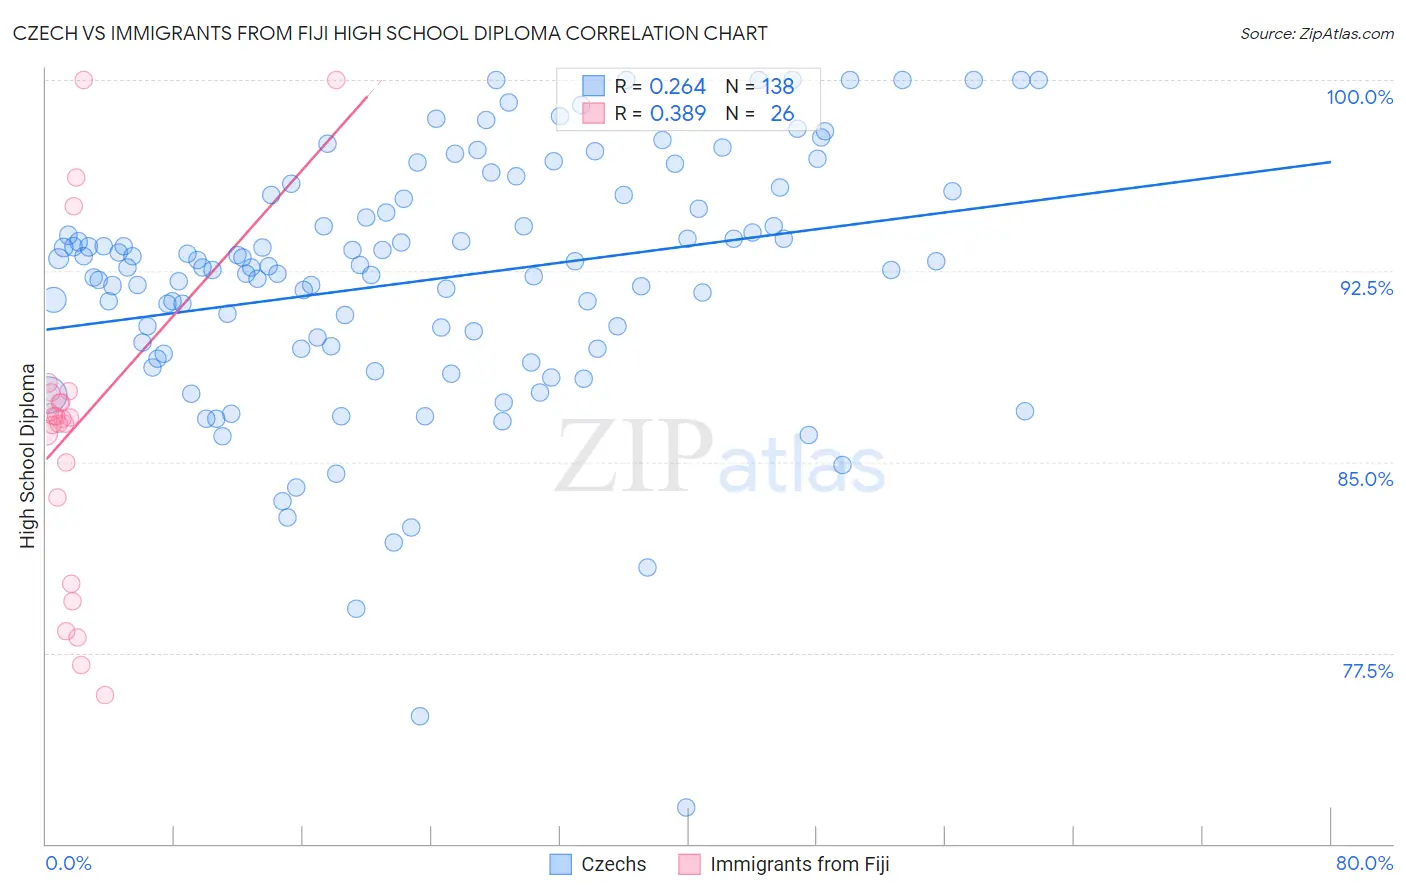
Czech vs Immigrants from Fiji High School Diploma Correlation Chart
The statistical analysis conducted on geographies consisting of 484,813,791 people shows a weak positive correlation between the proportion of Czechs and percentage of population with at least high school diploma education in the United States with a correlation coefficient (R) of 0.264 and weighted average of 91.6%. Similarly, the statistical analysis conducted on geographies consisting of 93,756,204 people shows a mild positive correlation between the proportion of Immigrants from Fiji and percentage of population with at least high school diploma education in the United States with a correlation coefficient (R) of 0.389 and weighted average of 85.8%, a difference of 6.7%.
High School Diploma Correlation Summary
| Measurement | Czech | Immigrants from Fiji |
| Minimum | 71.4% | 75.8% |
| Maximum | 100.0% | 100.0% |
| Range | 28.6% | 24.2% |
| Mean | 92.2% | 86.4% |
| Median | 92.7% | 86.7% |
| Interquartile 25% (IQ1) | 89.5% | 83.6% |
| Interquartile 75% (IQ3) | 95.3% | 87.7% |
| Interquartile Range (IQR) | 5.8% | 4.1% |
| Standard Deviation (Sample) | 5.0% | 6.3% |
| Standard Deviation (Population) | 4.9% | 6.1% |
Similar Demographics by High School Diploma
Demographics Similar to Czechs by High School Diploma
In terms of high school diploma, the demographic groups most similar to Czechs are Filipino (91.6%, a difference of 0.010%), Estonian (91.6%, a difference of 0.020%), Maltese (91.6%, a difference of 0.030%), Scandinavian (91.5%, a difference of 0.050%), and Italian (91.5%, a difference of 0.050%).
| Demographics | Rating | Rank | High School Diploma |
| Danes | 100.0 /100 | #13 | Exceptional 91.8% |
| Bulgarians | 100.0 /100 | #14 | Exceptional 91.8% |
| Luxembourgers | 100.0 /100 | #15 | Exceptional 91.7% |
| Finns | 100.0 /100 | #16 | Exceptional 91.7% |
| Immigrants | Singapore | 99.9 /100 | #17 | Exceptional 91.7% |
| Germans | 99.9 /100 | #18 | Exceptional 91.7% |
| Maltese | 99.9 /100 | #19 | Exceptional 91.6% |
| Czechs | 99.9 /100 | #20 | Exceptional 91.6% |
| Filipinos | 99.9 /100 | #21 | Exceptional 91.6% |
| Estonians | 99.9 /100 | #22 | Exceptional 91.6% |
| Scandinavians | 99.9 /100 | #23 | Exceptional 91.5% |
| Italians | 99.9 /100 | #24 | Exceptional 91.5% |
| Thais | 99.9 /100 | #25 | Exceptional 91.5% |
| Russians | 99.9 /100 | #26 | Exceptional 91.5% |
| Cypriots | 99.9 /100 | #27 | Exceptional 91.5% |
Demographics Similar to Immigrants from Fiji by High School Diploma
In terms of high school diploma, the demographic groups most similar to Immigrants from Fiji are Immigrants (85.8%, a difference of 0.020%), British West Indian (85.9%, a difference of 0.040%), Haitian (85.9%, a difference of 0.060%), Japanese (85.9%, a difference of 0.060%), and Fijian (86.0%, a difference of 0.19%).
| Demographics | Rating | Rank | High School Diploma |
| Ute | 0.0 /100 | #287 | Tragic 86.2% |
| Immigrants | Vietnam | 0.0 /100 | #288 | Tragic 86.2% |
| Yup'ik | 0.0 /100 | #289 | Tragic 86.1% |
| Fijians | 0.0 /100 | #290 | Tragic 86.0% |
| Haitians | 0.0 /100 | #291 | Tragic 85.9% |
| Japanese | 0.0 /100 | #292 | Tragic 85.9% |
| British West Indians | 0.0 /100 | #293 | Tragic 85.9% |
| Immigrants | Fiji | 0.0 /100 | #294 | Tragic 85.8% |
| Immigrants | Immigrants | 0.0 /100 | #295 | Tragic 85.8% |
| Immigrants | Cambodia | 0.0 /100 | #296 | Tragic 85.6% |
| Immigrants | Grenada | 0.0 /100 | #297 | Tragic 85.6% |
| Natives/Alaskans | 0.0 /100 | #298 | Tragic 85.6% |
| Guyanese | 0.0 /100 | #299 | Tragic 85.5% |
| Immigrants | Bangladesh | 0.0 /100 | #300 | Tragic 85.5% |
| Vietnamese | 0.0 /100 | #301 | Tragic 85.4% |