Finnish vs Immigrants from Burma/Myanmar High School Diploma
COMPARE
Finnish
Immigrants from Burma/Myanmar
High School Diploma
High School Diploma Comparison
Finns
Immigrants from Burma/Myanmar
91.7%
HIGH SCHOOL DIPLOMA
100.0/ 100
METRIC RATING
16th/ 347
METRIC RANK
86.7%
HIGH SCHOOL DIPLOMA
0.1/ 100
METRIC RATING
276th/ 347
METRIC RANK
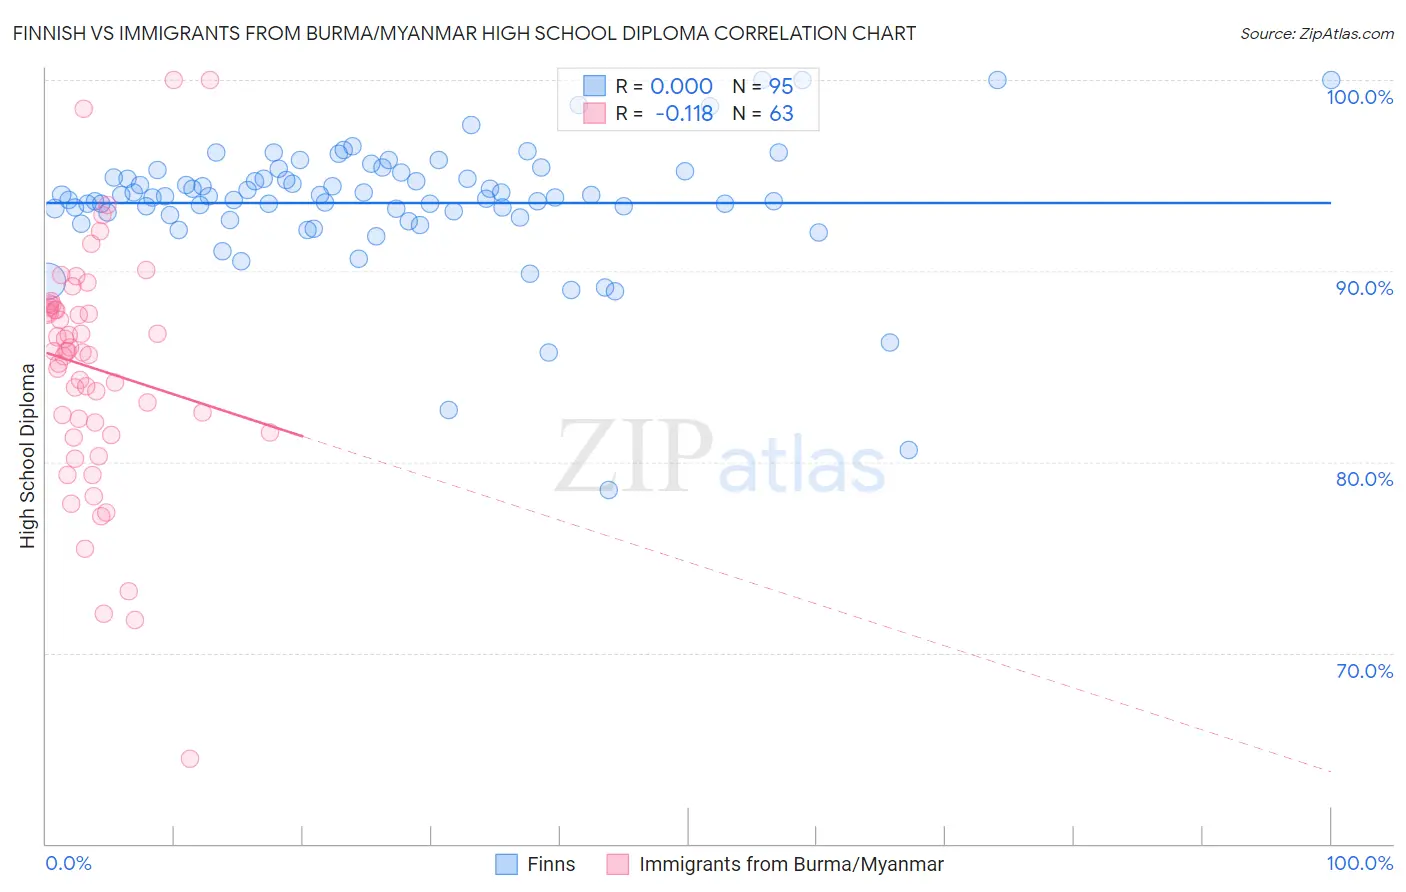
Finnish vs Immigrants from Burma/Myanmar High School Diploma Correlation Chart
The statistical analysis conducted on geographies consisting of 404,676,167 people shows no correlation between the proportion of Finns and percentage of population with at least high school diploma education in the United States with a correlation coefficient (R) of 0.000 and weighted average of 91.7%. Similarly, the statistical analysis conducted on geographies consisting of 172,345,696 people shows a poor negative correlation between the proportion of Immigrants from Burma/Myanmar and percentage of population with at least high school diploma education in the United States with a correlation coefficient (R) of -0.118 and weighted average of 86.7%, a difference of 5.8%.
High School Diploma Correlation Summary
| Measurement | Finnish | Immigrants from Burma/Myanmar |
| Minimum | 78.5% | 64.5% |
| Maximum | 100.0% | 100.0% |
| Range | 21.5% | 35.5% |
| Mean | 93.6% | 84.9% |
| Median | 93.9% | 85.8% |
| Interquartile 25% (IQ1) | 92.9% | 81.5% |
| Interquartile 75% (IQ3) | 95.2% | 88.1% |
| Interquartile Range (IQR) | 2.3% | 6.6% |
| Standard Deviation (Sample) | 3.4% | 6.3% |
| Standard Deviation (Population) | 3.4% | 6.3% |
Similar Demographics by High School Diploma
Demographics Similar to Finns by High School Diploma
In terms of high school diploma, the demographic groups most similar to Finns are Luxembourger (91.7%, a difference of 0.020%), Immigrants from Singapore (91.7%, a difference of 0.040%), Bulgarian (91.8%, a difference of 0.050%), German (91.7%, a difference of 0.050%), and Danish (91.8%, a difference of 0.10%).
| Demographics | Rating | Rank | High School Diploma |
| Latvians | 100.0 /100 | #9 | Exceptional 92.0% |
| Croatians | 100.0 /100 | #10 | Exceptional 92.0% |
| Eastern Europeans | 100.0 /100 | #11 | Exceptional 91.9% |
| Poles | 100.0 /100 | #12 | Exceptional 91.9% |
| Danes | 100.0 /100 | #13 | Exceptional 91.8% |
| Bulgarians | 100.0 /100 | #14 | Exceptional 91.8% |
| Luxembourgers | 100.0 /100 | #15 | Exceptional 91.7% |
| Finns | 100.0 /100 | #16 | Exceptional 91.7% |
| Immigrants | Singapore | 99.9 /100 | #17 | Exceptional 91.7% |
| Germans | 99.9 /100 | #18 | Exceptional 91.7% |
| Maltese | 99.9 /100 | #19 | Exceptional 91.6% |
| Czechs | 99.9 /100 | #20 | Exceptional 91.6% |
| Filipinos | 99.9 /100 | #21 | Exceptional 91.6% |
| Estonians | 99.9 /100 | #22 | Exceptional 91.6% |
| Scandinavians | 99.9 /100 | #23 | Exceptional 91.5% |
Demographics Similar to Immigrants from Burma/Myanmar by High School Diploma
In terms of high school diploma, the demographic groups most similar to Immigrants from Burma/Myanmar are Barbadian (86.7%, a difference of 0.010%), Immigrants from Trinidad and Tobago (86.8%, a difference of 0.070%), Hopi (86.6%, a difference of 0.11%), Immigrants from Laos (86.6%, a difference of 0.16%), and Pueblo (86.5%, a difference of 0.18%).
| Demographics | Rating | Rank | High School Diploma |
| Sri Lankans | 0.2 /100 | #269 | Tragic 87.0% |
| Malaysians | 0.2 /100 | #270 | Tragic 87.0% |
| West Indians | 0.1 /100 | #271 | Tragic 86.9% |
| Trinidadians and Tobagonians | 0.1 /100 | #272 | Tragic 86.9% |
| Immigrants | Jamaica | 0.1 /100 | #273 | Tragic 86.9% |
| Bangladeshis | 0.1 /100 | #274 | Tragic 86.9% |
| Immigrants | Trinidad and Tobago | 0.1 /100 | #275 | Tragic 86.8% |
| Immigrants | Burma/Myanmar | 0.1 /100 | #276 | Tragic 86.7% |
| Barbadians | 0.1 /100 | #277 | Tragic 86.7% |
| Hopi | 0.1 /100 | #278 | Tragic 86.6% |
| Immigrants | Laos | 0.0 /100 | #279 | Tragic 86.6% |
| Pueblo | 0.0 /100 | #280 | Tragic 86.5% |
| Indonesians | 0.0 /100 | #281 | Tragic 86.5% |
| Dutch West Indians | 0.0 /100 | #282 | Tragic 86.5% |
| Immigrants | Barbados | 0.0 /100 | #283 | Tragic 86.4% |