Filipino vs Irish 10th Grade
COMPARE
Filipino
Irish
10th Grade
10th Grade Comparison
Filipinos
Irish
94.8%
10TH GRADE
99.3/ 100
METRIC RATING
78th/ 347
METRIC RANK
95.6%
10TH GRADE
100.0/ 100
METRIC RATING
15th/ 347
METRIC RANK
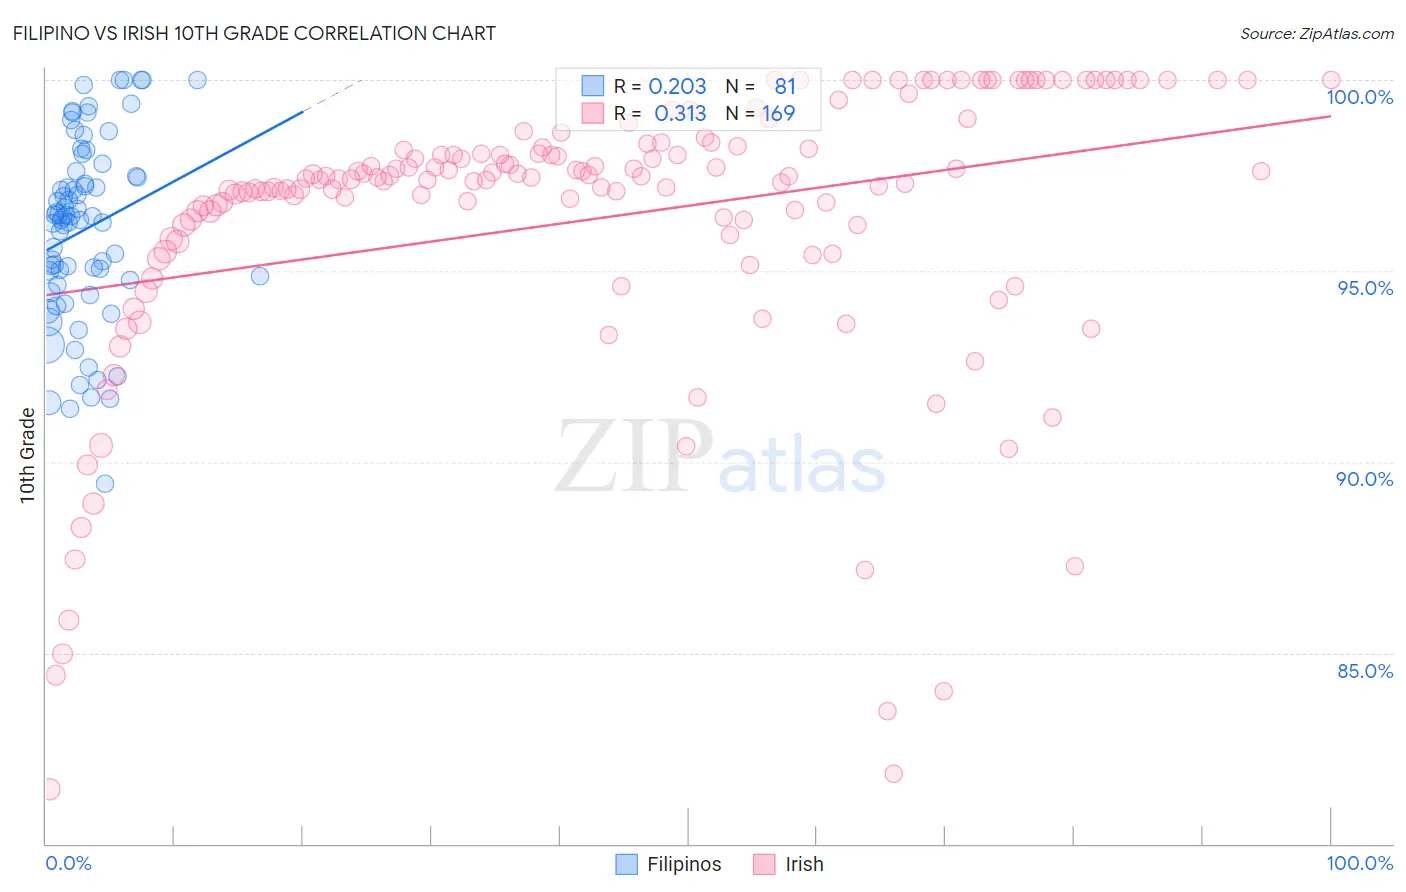
Filipino vs Irish 10th Grade Correlation Chart
The statistical analysis conducted on geographies consisting of 254,351,912 people shows a weak positive correlation between the proportion of Filipinos and percentage of population with at least 10th grade education in the United States with a correlation coefficient (R) of 0.203 and weighted average of 94.8%. Similarly, the statistical analysis conducted on geographies consisting of 580,709,891 people shows a mild positive correlation between the proportion of Irish and percentage of population with at least 10th grade education in the United States with a correlation coefficient (R) of 0.313 and weighted average of 95.6%, a difference of 0.86%.
10th Grade Correlation Summary
| Measurement | Filipino | Irish |
| Minimum | 89.4% | 81.4% |
| Maximum | 100.0% | 100.0% |
| Range | 10.6% | 18.6% |
| Mean | 96.1% | 96.4% |
| Median | 96.4% | 97.4% |
| Interquartile 25% (IQ1) | 94.7% | 95.9% |
| Interquartile 75% (IQ3) | 97.5% | 98.3% |
| Interquartile Range (IQR) | 2.8% | 2.4% |
| Standard Deviation (Sample) | 2.4% | 3.8% |
| Standard Deviation (Population) | 2.4% | 3.8% |
Similar Demographics by 10th Grade
Demographics Similar to Filipinos by 10th Grade
In terms of 10th grade, the demographic groups most similar to Filipinos are Immigrants from Czechoslovakia (94.7%, a difference of 0.030%), Immigrants from Denmark (94.7%, a difference of 0.040%), Immigrants from Latvia (94.7%, a difference of 0.040%), Romanian (94.8%, a difference of 0.060%), and Immigrants from South Africa (94.8%, a difference of 0.060%).
| Demographics | Rating | Rank | 10th Grade |
| Alaska Natives | 99.6 /100 | #71 | Exceptional 94.9% |
| Immigrants | Sweden | 99.6 /100 | #72 | Exceptional 94.9% |
| Bhutanese | 99.6 /100 | #73 | Exceptional 94.9% |
| Canadians | 99.6 /100 | #74 | Exceptional 94.9% |
| Okinawans | 99.5 /100 | #75 | Exceptional 94.8% |
| Romanians | 99.5 /100 | #76 | Exceptional 94.8% |
| Immigrants | South Africa | 99.5 /100 | #77 | Exceptional 94.8% |
| Filipinos | 99.3 /100 | #78 | Exceptional 94.8% |
| Immigrants | Czechoslovakia | 99.2 /100 | #79 | Exceptional 94.7% |
| Immigrants | Denmark | 99.2 /100 | #80 | Exceptional 94.7% |
| Immigrants | Latvia | 99.2 /100 | #81 | Exceptional 94.7% |
| Swiss | 99.1 /100 | #82 | Exceptional 94.7% |
| Immigrants | Western Europe | 99.1 /100 | #83 | Exceptional 94.7% |
| Icelanders | 99.1 /100 | #84 | Exceptional 94.7% |
| Crow | 99.0 /100 | #85 | Exceptional 94.7% |
Demographics Similar to Irish by 10th Grade
In terms of 10th grade, the demographic groups most similar to Irish are Scottish (95.6%, a difference of 0.010%), Tsimshian (95.6%, a difference of 0.020%), Latvian (95.6%, a difference of 0.020%), English (95.6%, a difference of 0.030%), and Italian (95.6%, a difference of 0.030%).
| Demographics | Rating | Rank | 10th Grade |
| Lithuanians | 100.0 /100 | #8 | Exceptional 95.8% |
| Finns | 100.0 /100 | #9 | Exceptional 95.8% |
| Croatians | 100.0 /100 | #10 | Exceptional 95.7% |
| Danes | 100.0 /100 | #11 | Exceptional 95.7% |
| Tlingit-Haida | 100.0 /100 | #12 | Exceptional 95.7% |
| English | 100.0 /100 | #13 | Exceptional 95.6% |
| Tsimshian | 100.0 /100 | #14 | Exceptional 95.6% |
| Irish | 100.0 /100 | #15 | Exceptional 95.6% |
| Scottish | 100.0 /100 | #16 | Exceptional 95.6% |
| Latvians | 100.0 /100 | #17 | Exceptional 95.6% |
| Italians | 100.0 /100 | #18 | Exceptional 95.6% |
| Scandinavians | 100.0 /100 | #19 | Exceptional 95.6% |
| Chinese | 100.0 /100 | #20 | Exceptional 95.5% |
| Dutch | 100.0 /100 | #21 | Exceptional 95.5% |
| Eastern Europeans | 100.0 /100 | #22 | Exceptional 95.5% |