Fijian vs Immigrants from Iraq Unemployment Among Ages 16 to 19 years
COMPARE
Fijian
Immigrants from Iraq
Unemployment Among Ages 16 to 19 years
Unemployment Among Ages 16 to 19 years Comparison
Fijians
Immigrants from Iraq
16.3%
UNEMPLOYMENT AMONG AGES 16 TO 19 YEARS
99.8/ 100
METRIC RATING
42nd/ 347
METRIC RANK
17.0%
UNEMPLOYMENT AMONG AGES 16 TO 19 YEARS
93.7/ 100
METRIC RATING
112th/ 347
METRIC RANK
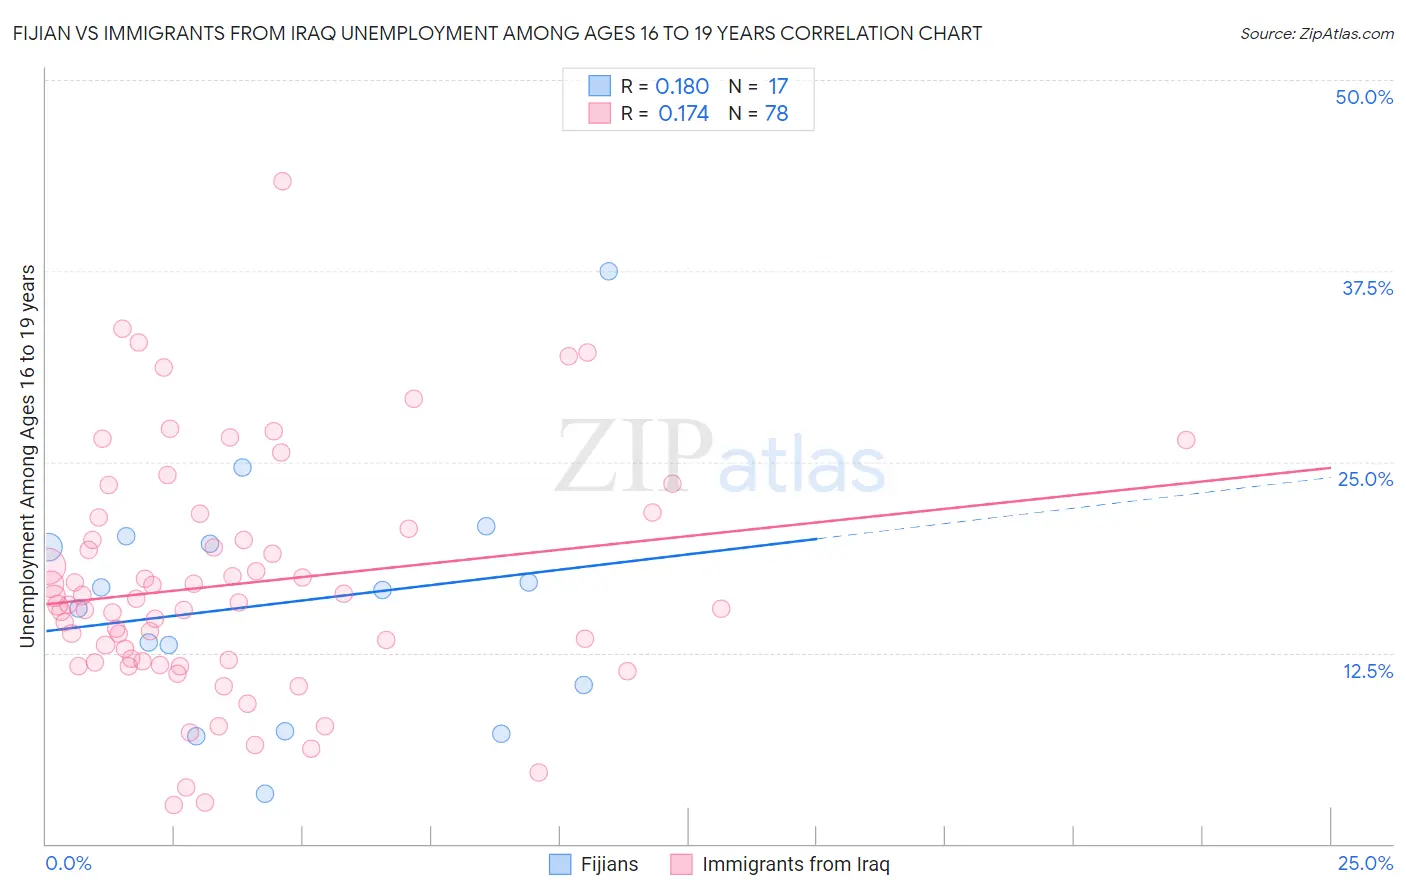
Fijian vs Immigrants from Iraq Unemployment Among Ages 16 to 19 years Correlation Chart
The statistical analysis conducted on geographies consisting of 55,217,805 people shows a poor positive correlation between the proportion of Fijians and unemployment rate among population between the ages 16 and 19 in the United States with a correlation coefficient (R) of 0.180 and weighted average of 16.3%. Similarly, the statistical analysis conducted on geographies consisting of 189,846,896 people shows a poor positive correlation between the proportion of Immigrants from Iraq and unemployment rate among population between the ages 16 and 19 in the United States with a correlation coefficient (R) of 0.174 and weighted average of 17.0%, a difference of 4.3%.
Unemployment Among Ages 16 to 19 years Correlation Summary
| Measurement | Fijian | Immigrants from Iraq |
| Minimum | 3.3% | 2.5% |
| Maximum | 37.5% | 43.4% |
| Range | 34.2% | 40.9% |
| Mean | 15.8% | 17.0% |
| Median | 16.6% | 15.7% |
| Interquartile 25% (IQ1) | 8.9% | 12.0% |
| Interquartile 75% (IQ3) | 19.9% | 20.6% |
| Interquartile Range (IQR) | 11.0% | 8.6% |
| Standard Deviation (Sample) | 8.1% | 7.7% |
| Standard Deviation (Population) | 7.8% | 7.7% |
Similar Demographics by Unemployment Among Ages 16 to 19 years
Demographics Similar to Fijians by Unemployment Among Ages 16 to 19 years
In terms of unemployment among ages 16 to 19 years, the demographic groups most similar to Fijians are Immigrants from Nepal (16.3%, a difference of 0.030%), Immigrants from Lebanon (16.3%, a difference of 0.070%), Hmong (16.3%, a difference of 0.12%), Immigrants from Zimbabwe (16.3%, a difference of 0.20%), and Polish (16.4%, a difference of 0.22%).
| Demographics | Rating | Rank | Unemployment Among Ages 16 to 19 years |
| Scottish | 99.8 /100 | #35 | Exceptional 16.2% |
| Immigrants | South Central Asia | 99.8 /100 | #36 | Exceptional 16.2% |
| Immigrants | Congo | 99.8 /100 | #37 | Exceptional 16.3% |
| Bulgarians | 99.8 /100 | #38 | Exceptional 16.3% |
| Croatians | 99.8 /100 | #39 | Exceptional 16.3% |
| Hmong | 99.8 /100 | #40 | Exceptional 16.3% |
| Immigrants | Nepal | 99.8 /100 | #41 | Exceptional 16.3% |
| Fijians | 99.8 /100 | #42 | Exceptional 16.3% |
| Immigrants | Lebanon | 99.8 /100 | #43 | Exceptional 16.3% |
| Immigrants | Zimbabwe | 99.7 /100 | #44 | Exceptional 16.3% |
| Poles | 99.7 /100 | #45 | Exceptional 16.4% |
| Immigrants | North Macedonia | 99.7 /100 | #46 | Exceptional 16.4% |
| Immigrants | Vietnam | 99.7 /100 | #47 | Exceptional 16.4% |
| Maltese | 99.7 /100 | #48 | Exceptional 16.4% |
| Iraqis | 99.7 /100 | #49 | Exceptional 16.4% |
Demographics Similar to Immigrants from Iraq by Unemployment Among Ages 16 to 19 years
In terms of unemployment among ages 16 to 19 years, the demographic groups most similar to Immigrants from Iraq are Immigrants from Asia (17.0%, a difference of 0.030%), Immigrants from Netherlands (17.0%, a difference of 0.040%), Icelander (17.0%, a difference of 0.060%), Iranian (17.0%, a difference of 0.080%), and Immigrants from Brazil (17.0%, a difference of 0.10%).
| Demographics | Rating | Rank | Unemployment Among Ages 16 to 19 years |
| Immigrants | Bulgaria | 94.3 /100 | #105 | Exceptional 17.0% |
| Estonians | 94.3 /100 | #106 | Exceptional 17.0% |
| Immigrants | Brazil | 94.2 /100 | #107 | Exceptional 17.0% |
| Malaysians | 94.2 /100 | #108 | Exceptional 17.0% |
| Iranians | 94.1 /100 | #109 | Exceptional 17.0% |
| Immigrants | Netherlands | 93.9 /100 | #110 | Exceptional 17.0% |
| Immigrants | Asia | 93.9 /100 | #111 | Exceptional 17.0% |
| Immigrants | Iraq | 93.7 /100 | #112 | Exceptional 17.0% |
| Icelanders | 93.4 /100 | #113 | Exceptional 17.0% |
| Immigrants | Poland | 93.1 /100 | #114 | Exceptional 17.0% |
| Brazilians | 92.3 /100 | #115 | Exceptional 17.1% |
| Immigrants | Korea | 92.2 /100 | #116 | Exceptional 17.1% |
| Immigrants | Sri Lanka | 92.0 /100 | #117 | Exceptional 17.1% |
| Venezuelans | 91.8 /100 | #118 | Exceptional 17.1% |
| Hungarians | 91.6 /100 | #119 | Exceptional 17.1% |