Fijian vs Irish No Schooling Completed
COMPARE
Fijian
Irish
No Schooling Completed
No Schooling Completed Comparison
Fijians
Irish
2.5%
NO SCHOOLING COMPLETED
0.4/ 100
METRIC RATING
266th/ 347
METRIC RANK
1.4%
NO SCHOOLING COMPLETED
100.0/ 100
METRIC RATING
12th/ 347
METRIC RANK
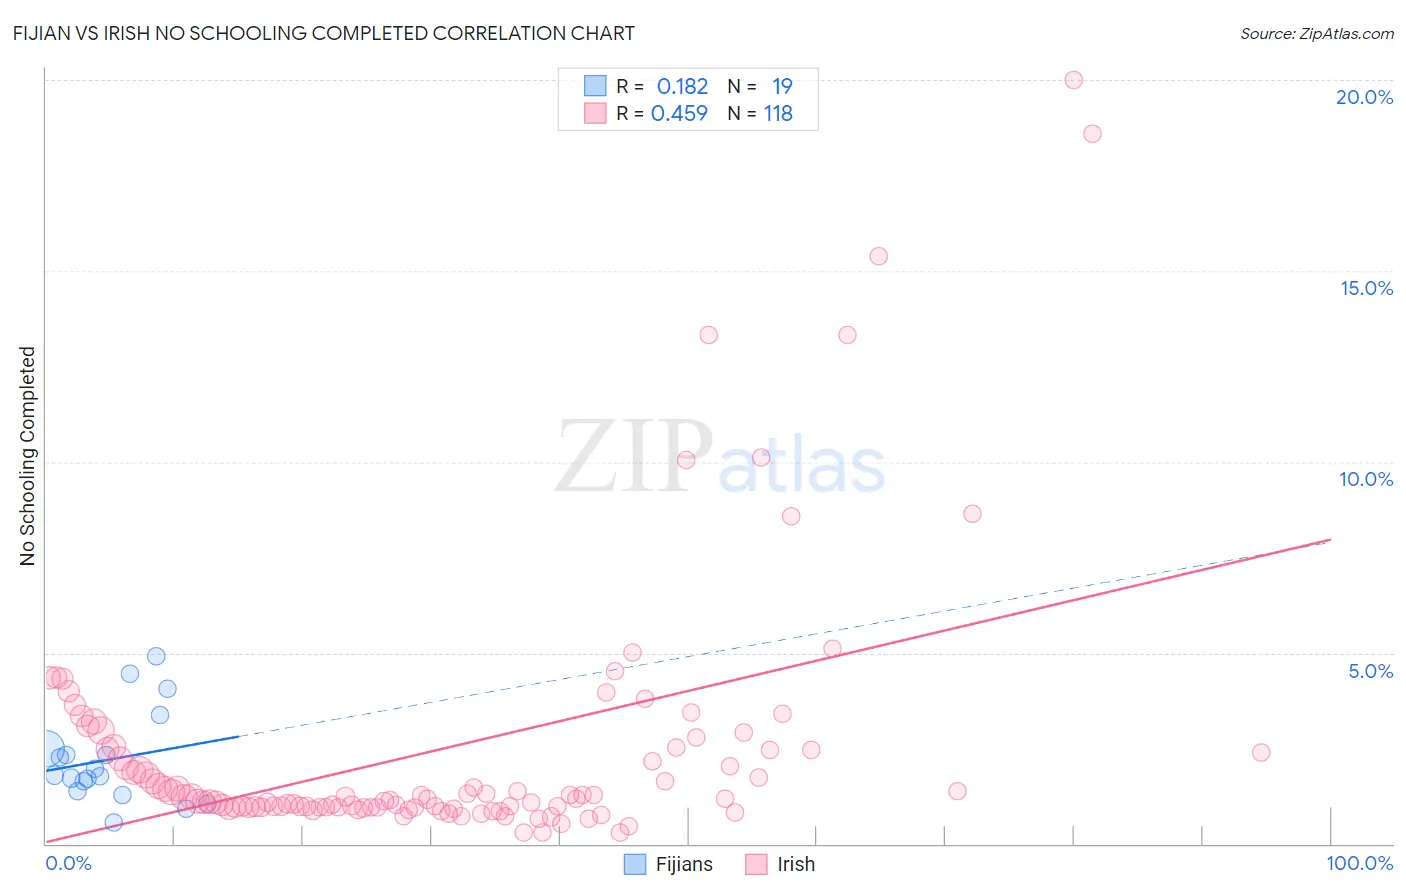
Fijian vs Irish No Schooling Completed Correlation Chart
The statistical analysis conducted on geographies consisting of 55,808,441 people shows a poor positive correlation between the proportion of Fijians and percentage of population with no schooling in the United States with a correlation coefficient (R) of 0.182 and weighted average of 2.5%. Similarly, the statistical analysis conducted on geographies consisting of 558,904,841 people shows a moderate positive correlation between the proportion of Irish and percentage of population with no schooling in the United States with a correlation coefficient (R) of 0.459 and weighted average of 1.4%, a difference of 72.6%.
No Schooling Completed Correlation Summary
| Measurement | Fijian | Irish |
| Minimum | 0.56% | 0.30% |
| Maximum | 4.9% | 20.0% |
| Range | 4.4% | 19.7% |
| Mean | 2.2% | 2.5% |
| Median | 1.8% | 1.2% |
| Interquartile 25% (IQ1) | 1.4% | 0.96% |
| Interquartile 75% (IQ3) | 2.5% | 2.5% |
| Interquartile Range (IQR) | 1.1% | 1.5% |
| Standard Deviation (Sample) | 1.2% | 3.4% |
| Standard Deviation (Population) | 1.2% | 3.4% |
Similar Demographics by No Schooling Completed
Demographics Similar to Fijians by No Schooling Completed
In terms of no schooling completed, the demographic groups most similar to Fijians are West Indian (2.5%, a difference of 0.080%), Yuman (2.5%, a difference of 0.17%), Indian (Asian) (2.5%, a difference of 0.26%), Immigrants from Liberia (2.5%, a difference of 0.39%), and Taiwanese (2.5%, a difference of 0.44%).
| Demographics | Rating | Rank | No Schooling Completed |
| Immigrants | Jamaica | 0.6 /100 | #259 | Tragic 2.5% |
| Immigrants | Ethiopia | 0.6 /100 | #260 | Tragic 2.5% |
| Armenians | 0.5 /100 | #261 | Tragic 2.5% |
| Immigrants | Sierra Leone | 0.5 /100 | #262 | Tragic 2.5% |
| Immigrants | Liberia | 0.4 /100 | #263 | Tragic 2.5% |
| Indians (Asian) | 0.4 /100 | #264 | Tragic 2.5% |
| West Indians | 0.4 /100 | #265 | Tragic 2.5% |
| Fijians | 0.4 /100 | #266 | Tragic 2.5% |
| Yuman | 0.4 /100 | #267 | Tragic 2.5% |
| Taiwanese | 0.3 /100 | #268 | Tragic 2.5% |
| Immigrants | Nigeria | 0.2 /100 | #269 | Tragic 2.5% |
| Immigrants | Peru | 0.2 /100 | #270 | Tragic 2.5% |
| Cubans | 0.2 /100 | #271 | Tragic 2.5% |
| Immigrants | Bolivia | 0.2 /100 | #272 | Tragic 2.5% |
| Immigrants | Cameroon | 0.1 /100 | #273 | Tragic 2.5% |
Demographics Similar to Irish by No Schooling Completed
In terms of no schooling completed, the demographic groups most similar to Irish are Lithuanian (1.4%, a difference of 0.030%), Polish (1.4%, a difference of 0.030%), Dutch (1.4%, a difference of 0.86%), Scotch-Irish (1.5%, a difference of 0.97%), and Tlingit-Haida (1.5%, a difference of 1.0%).
| Demographics | Rating | Rank | No Schooling Completed |
| Slovenes | 100.0 /100 | #5 | Exceptional 1.4% |
| Carpatho Rusyns | 100.0 /100 | #6 | Exceptional 1.4% |
| English | 100.0 /100 | #7 | Exceptional 1.4% |
| Swedes | 100.0 /100 | #8 | Exceptional 1.4% |
| Scottish | 100.0 /100 | #9 | Exceptional 1.4% |
| Dutch | 100.0 /100 | #10 | Exceptional 1.4% |
| Lithuanians | 100.0 /100 | #11 | Exceptional 1.4% |
| Irish | 100.0 /100 | #12 | Exceptional 1.4% |
| Poles | 100.0 /100 | #13 | Exceptional 1.4% |
| Scotch-Irish | 100.0 /100 | #14 | Exceptional 1.5% |
| Tlingit-Haida | 100.0 /100 | #15 | Exceptional 1.5% |
| Finns | 100.0 /100 | #16 | Exceptional 1.5% |
| Croatians | 100.0 /100 | #17 | Exceptional 1.5% |
| Danes | 100.0 /100 | #18 | Exceptional 1.5% |
| Alaskan Athabascans | 100.0 /100 | #19 | Exceptional 1.5% |