Fijian vs Jamaican 8th Grade
COMPARE
Fijian
Jamaican
8th Grade
8th Grade Comparison
Fijians
Jamaicans
94.2%
8TH GRADE
0.0/ 100
METRIC RATING
295th/ 347
METRIC RANK
95.1%
8TH GRADE
1.4/ 100
METRIC RATING
245th/ 347
METRIC RANK
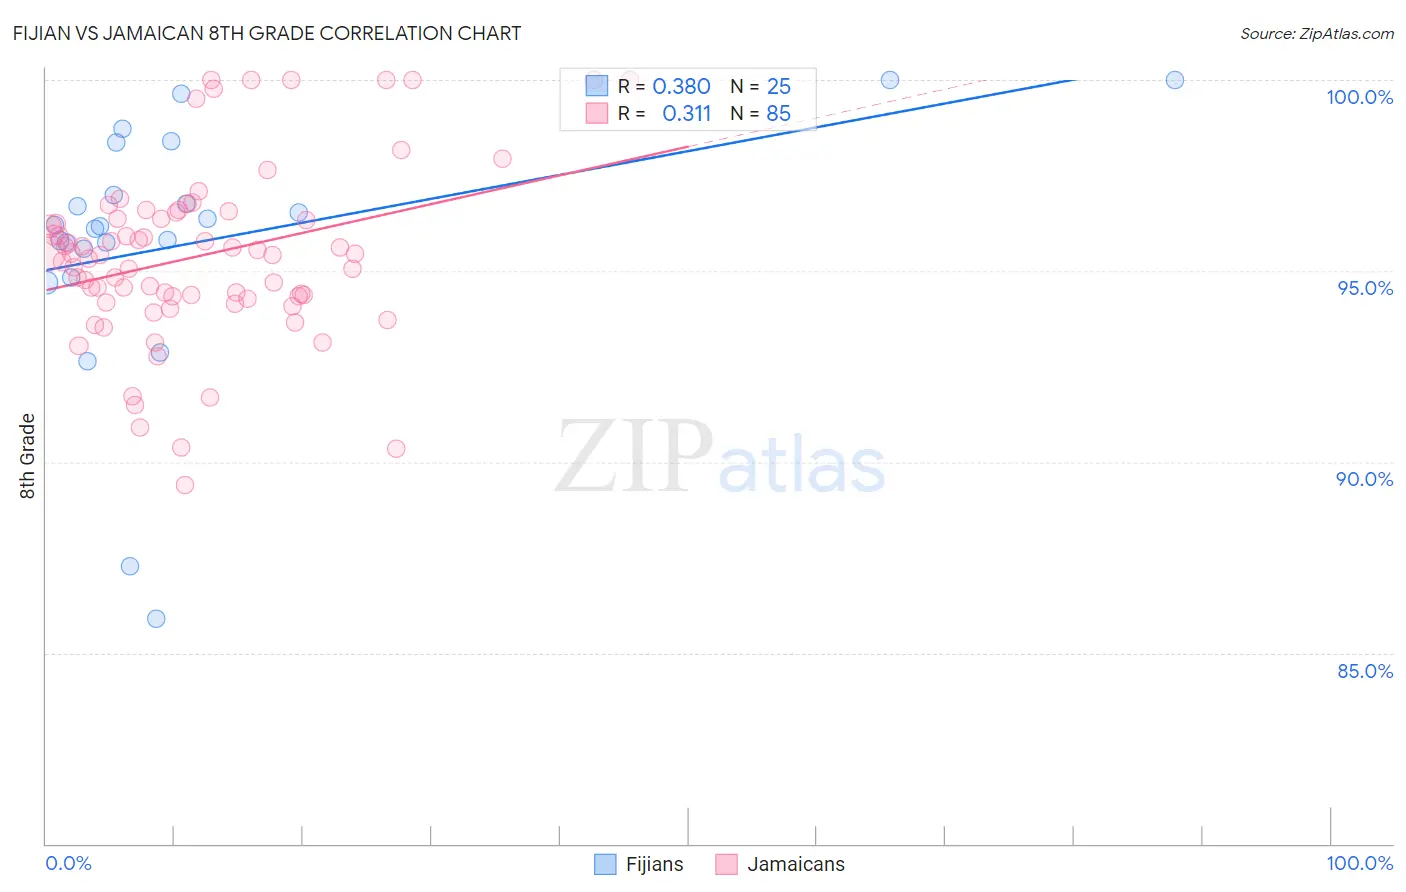
Fijian vs Jamaican 8th Grade Correlation Chart
The statistical analysis conducted on geographies consisting of 55,948,842 people shows a mild positive correlation between the proportion of Fijians and percentage of population with at least 8th grade education in the United States with a correlation coefficient (R) of 0.380 and weighted average of 94.2%. Similarly, the statistical analysis conducted on geographies consisting of 368,084,732 people shows a mild positive correlation between the proportion of Jamaicans and percentage of population with at least 8th grade education in the United States with a correlation coefficient (R) of 0.311 and weighted average of 95.1%, a difference of 0.92%.
8th Grade Correlation Summary
| Measurement | Fijian | Jamaican |
| Minimum | 85.9% | 89.4% |
| Maximum | 100.0% | 100.0% |
| Range | 14.1% | 10.6% |
| Mean | 95.8% | 95.4% |
| Median | 96.2% | 95.4% |
| Interquartile 25% (IQ1) | 95.2% | 94.3% |
| Interquartile 75% (IQ3) | 97.7% | 96.5% |
| Interquartile Range (IQR) | 2.5% | 2.2% |
| Standard Deviation (Sample) | 3.3% | 2.3% |
| Standard Deviation (Population) | 3.3% | 2.3% |
Similar Demographics by 8th Grade
Demographics Similar to Fijians by 8th Grade
In terms of 8th grade, the demographic groups most similar to Fijians are Yaqui (94.2%, a difference of 0.010%), Houma (94.2%, a difference of 0.010%), Haitian (94.2%, a difference of 0.020%), Immigrants from South Eastern Asia (94.2%, a difference of 0.030%), and Bangladeshi (94.3%, a difference of 0.040%).
| Demographics | Rating | Rank | 8th Grade |
| Malaysians | 0.0 /100 | #288 | Tragic 94.5% |
| British West Indians | 0.0 /100 | #289 | Tragic 94.4% |
| Immigrants | West Indies | 0.0 /100 | #290 | Tragic 94.3% |
| Immigrants | Grenada | 0.0 /100 | #291 | Tragic 94.3% |
| Bangladeshis | 0.0 /100 | #292 | Tragic 94.3% |
| Yaqui | 0.0 /100 | #293 | Tragic 94.2% |
| Houma | 0.0 /100 | #294 | Tragic 94.2% |
| Fijians | 0.0 /100 | #295 | Tragic 94.2% |
| Haitians | 0.0 /100 | #296 | Tragic 94.2% |
| Immigrants | South Eastern Asia | 0.0 /100 | #297 | Tragic 94.2% |
| Indonesians | 0.0 /100 | #298 | Tragic 94.1% |
| Cubans | 0.0 /100 | #299 | Tragic 94.1% |
| Immigrants | Burma/Myanmar | 0.0 /100 | #300 | Tragic 94.1% |
| Immigrants | Laos | 0.0 /100 | #301 | Tragic 94.1% |
| Sri Lankans | 0.0 /100 | #302 | Tragic 94.0% |
Demographics Similar to Jamaicans by 8th Grade
In terms of 8th grade, the demographic groups most similar to Jamaicans are Somali (95.1%, a difference of 0.010%), Immigrants from Senegal (95.1%, a difference of 0.010%), Uruguayan (95.1%, a difference of 0.020%), Tongan (95.1%, a difference of 0.030%), and Paiute (95.1%, a difference of 0.030%).
| Demographics | Rating | Rank | 8th Grade |
| Natives/Alaskans | 2.3 /100 | #238 | Tragic 95.2% |
| Immigrants | Sierra Leone | 2.1 /100 | #239 | Tragic 95.1% |
| Ethiopians | 2.0 /100 | #240 | Tragic 95.1% |
| South American Indians | 1.9 /100 | #241 | Tragic 95.1% |
| Tongans | 1.7 /100 | #242 | Tragic 95.1% |
| Paiute | 1.7 /100 | #243 | Tragic 95.1% |
| Immigrants | Middle Africa | 1.7 /100 | #244 | Tragic 95.1% |
| Jamaicans | 1.4 /100 | #245 | Tragic 95.1% |
| Somalis | 1.4 /100 | #246 | Tragic 95.1% |
| Immigrants | Senegal | 1.4 /100 | #247 | Tragic 95.1% |
| Uruguayans | 1.2 /100 | #248 | Tragic 95.1% |
| Immigrants | China | 1.1 /100 | #249 | Tragic 95.0% |
| Koreans | 1.1 /100 | #250 | Tragic 95.0% |
| Bolivians | 1.0 /100 | #251 | Tragic 95.0% |
| Immigrants | Ethiopia | 1.0 /100 | #252 | Tragic 95.0% |