Ethiopian vs Immigrants from Laos 2nd Grade
COMPARE
Ethiopian
Immigrants from Laos
2nd Grade
2nd Grade Comparison
Ethiopians
Immigrants from Laos
97.5%
2ND GRADE
1.2/ 100
METRIC RATING
241st/ 347
METRIC RANK
96.7%
2ND GRADE
0.0/ 100
METRIC RATING
317th/ 347
METRIC RANK
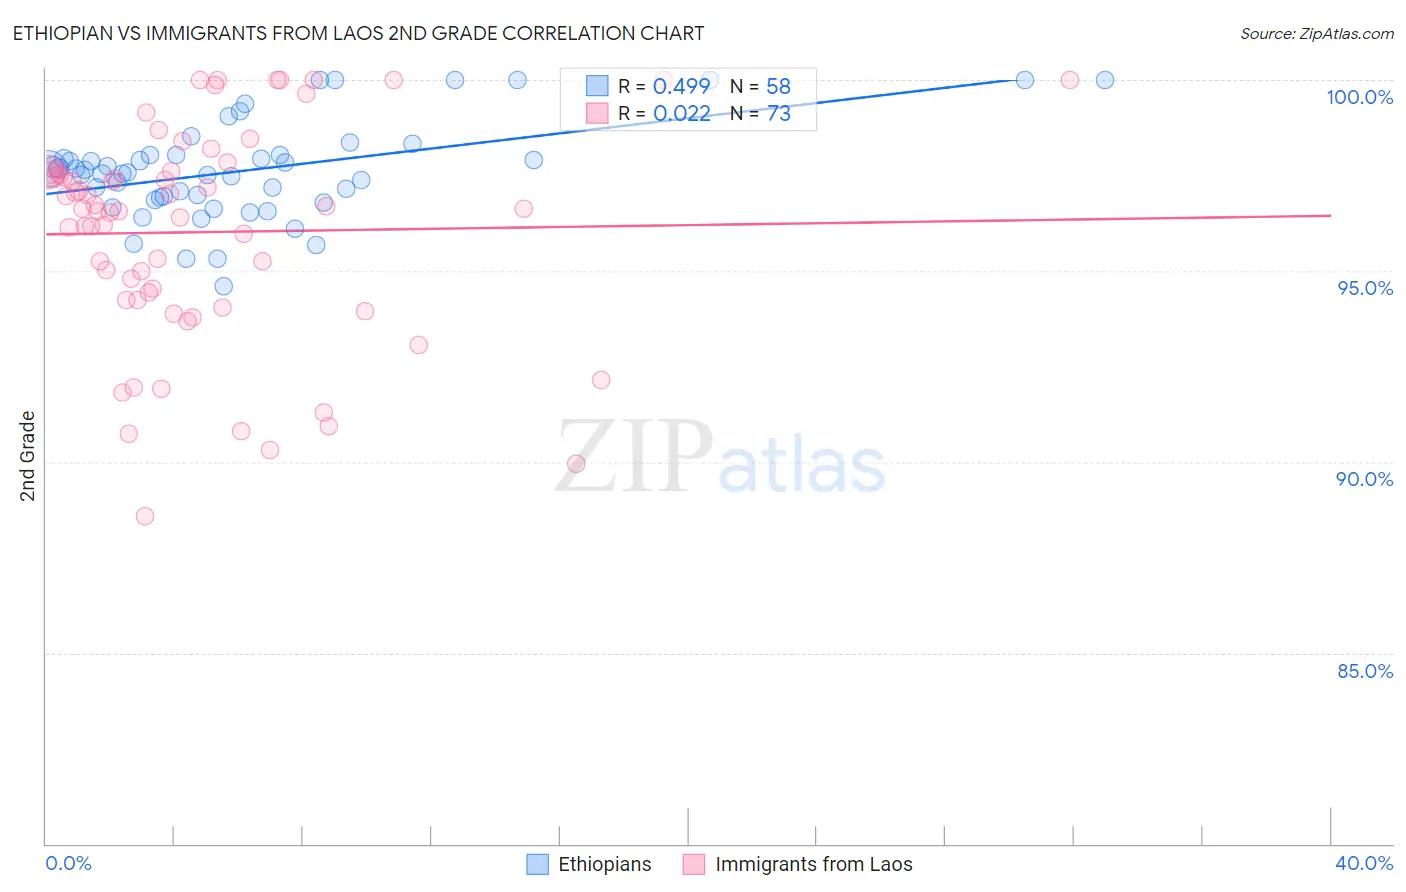
Ethiopian vs Immigrants from Laos 2nd Grade Correlation Chart
The statistical analysis conducted on geographies consisting of 223,120,541 people shows a moderate positive correlation between the proportion of Ethiopians and percentage of population with at least 2nd grade education in the United States with a correlation coefficient (R) of 0.499 and weighted average of 97.5%. Similarly, the statistical analysis conducted on geographies consisting of 201,453,273 people shows no correlation between the proportion of Immigrants from Laos and percentage of population with at least 2nd grade education in the United States with a correlation coefficient (R) of 0.022 and weighted average of 96.7%, a difference of 0.81%.
2nd Grade Correlation Summary
| Measurement | Ethiopian | Immigrants from Laos |
| Minimum | 94.6% | 88.6% |
| Maximum | 100.0% | 100.0% |
| Range | 5.4% | 11.4% |
| Mean | 97.6% | 96.0% |
| Median | 97.6% | 96.6% |
| Interquartile 25% (IQ1) | 96.9% | 94.2% |
| Interquartile 75% (IQ3) | 98.0% | 97.6% |
| Interquartile Range (IQR) | 1.1% | 3.4% |
| Standard Deviation (Sample) | 1.3% | 2.8% |
| Standard Deviation (Population) | 1.2% | 2.8% |
Similar Demographics by 2nd Grade
Demographics Similar to Ethiopians by 2nd Grade
In terms of 2nd grade, the demographic groups most similar to Ethiopians are Immigrants from Indonesia (97.5%, a difference of 0.0%), Korean (97.5%, a difference of 0.010%), Asian (97.5%, a difference of 0.010%), Nigerian (97.6%, a difference of 0.020%), and U.S. Virgin Islander (97.6%, a difference of 0.020%).
| Demographics | Rating | Rank | 2nd Grade |
| Immigrants | Malaysia | 2.0 /100 | #234 | Tragic 97.6% |
| Colombians | 1.9 /100 | #235 | Tragic 97.6% |
| Nigerians | 1.7 /100 | #236 | Tragic 97.6% |
| U.S. Virgin Islanders | 1.6 /100 | #237 | Tragic 97.6% |
| Immigrants | Eastern Asia | 1.6 /100 | #238 | Tragic 97.6% |
| Liberians | 1.6 /100 | #239 | Tragic 97.6% |
| Koreans | 1.5 /100 | #240 | Tragic 97.5% |
| Ethiopians | 1.2 /100 | #241 | Tragic 97.5% |
| Immigrants | Indonesia | 1.2 /100 | #242 | Tragic 97.5% |
| Asians | 1.1 /100 | #243 | Tragic 97.5% |
| Immigrants | Iraq | 1.0 /100 | #244 | Tragic 97.5% |
| Immigrants | Eastern Africa | 0.9 /100 | #245 | Tragic 97.5% |
| South Americans | 0.9 /100 | #246 | Tragic 97.5% |
| Immigrants | Senegal | 0.9 /100 | #247 | Tragic 97.5% |
| Immigrants | Middle Africa | 0.9 /100 | #248 | Tragic 97.5% |
Demographics Similar to Immigrants from Laos by 2nd Grade
In terms of 2nd grade, the demographic groups most similar to Immigrants from Laos are Honduran (96.7%, a difference of 0.0%), Indonesian (96.7%, a difference of 0.0%), Immigrants from Nicaragua (96.7%, a difference of 0.0%), Immigrants from Belize (96.8%, a difference of 0.010%), and Immigrants from Guyana (96.7%, a difference of 0.010%).
| Demographics | Rating | Rank | 2nd Grade |
| Sri Lankans | 0.0 /100 | #310 | Tragic 96.8% |
| Guyanese | 0.0 /100 | #311 | Tragic 96.8% |
| Cape Verdeans | 0.0 /100 | #312 | Tragic 96.8% |
| Hispanics or Latinos | 0.0 /100 | #313 | Tragic 96.8% |
| Immigrants | Ecuador | 0.0 /100 | #314 | Tragic 96.8% |
| Immigrants | Belize | 0.0 /100 | #315 | Tragic 96.8% |
| Hondurans | 0.0 /100 | #316 | Tragic 96.7% |
| Immigrants | Laos | 0.0 /100 | #317 | Tragic 96.7% |
| Indonesians | 0.0 /100 | #318 | Tragic 96.7% |
| Immigrants | Nicaragua | 0.0 /100 | #319 | Tragic 96.7% |
| Immigrants | Guyana | 0.0 /100 | #320 | Tragic 96.7% |
| Immigrants | Burma/Myanmar | 0.0 /100 | #321 | Tragic 96.7% |
| Immigrants | Bangladesh | 0.0 /100 | #322 | Tragic 96.7% |
| Vietnamese | 0.0 /100 | #323 | Tragic 96.7% |
| Mexican American Indians | 0.0 /100 | #324 | Tragic 96.7% |