Ethiopian vs Lithuanian 9th Grade
COMPARE
Ethiopian
Lithuanian
9th Grade
9th Grade Comparison
Ethiopians
Lithuanians
94.4%
9TH GRADE
5.4/ 100
METRIC RATING
225th/ 347
METRIC RANK
96.6%
9TH GRADE
100.0/ 100
METRIC RATING
10th/ 347
METRIC RANK
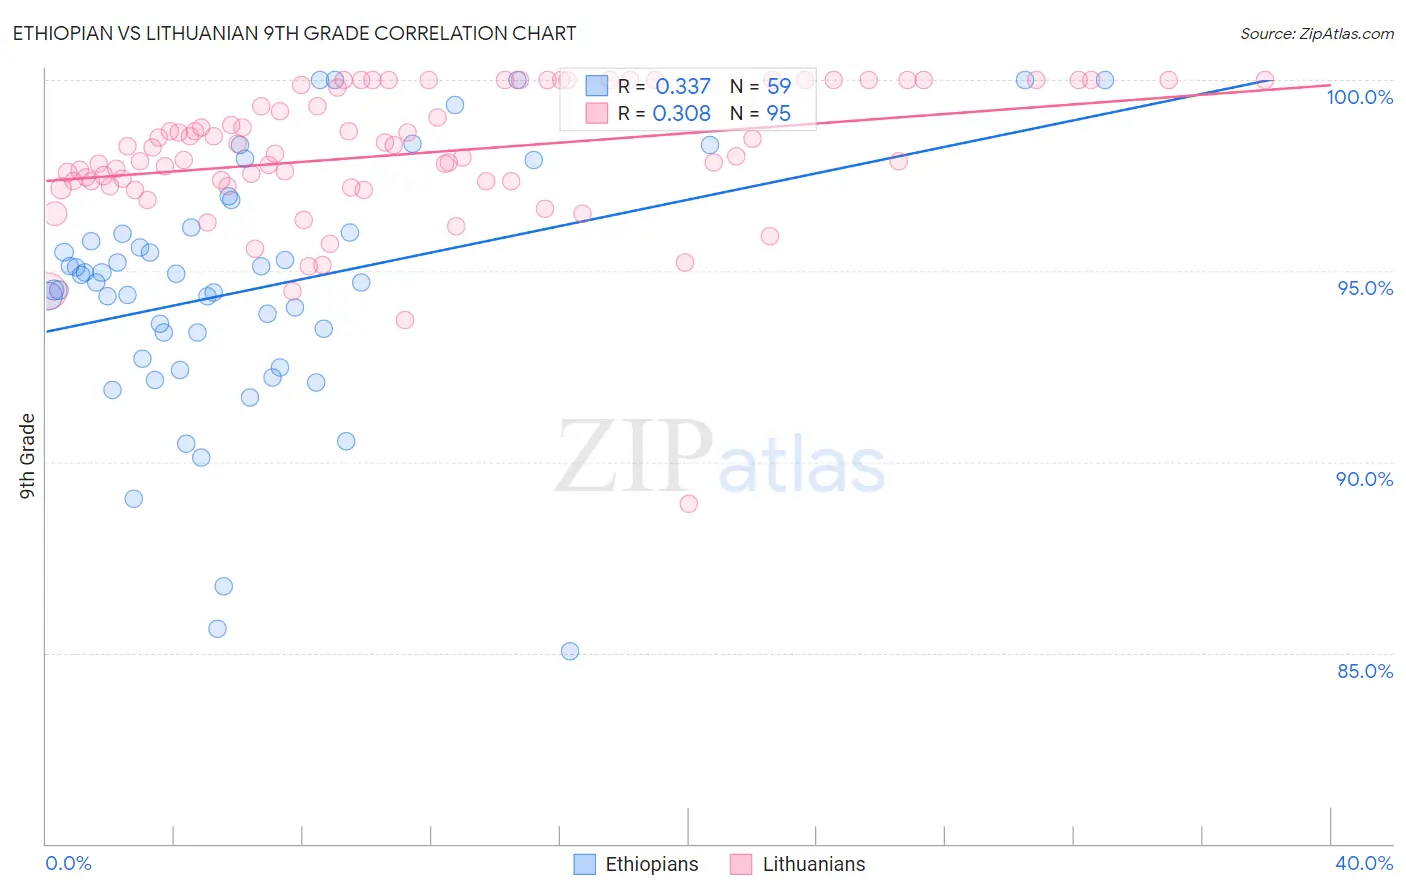
Ethiopian vs Lithuanian 9th Grade Correlation Chart
The statistical analysis conducted on geographies consisting of 223,135,094 people shows a mild positive correlation between the proportion of Ethiopians and percentage of population with at least 9th grade education in the United States with a correlation coefficient (R) of 0.337 and weighted average of 94.4%. Similarly, the statistical analysis conducted on geographies consisting of 421,947,524 people shows a mild positive correlation between the proportion of Lithuanians and percentage of population with at least 9th grade education in the United States with a correlation coefficient (R) of 0.308 and weighted average of 96.6%, a difference of 2.4%.
9th Grade Correlation Summary
| Measurement | Ethiopian | Lithuanian |
| Minimum | 85.0% | 88.9% |
| Maximum | 100.0% | 100.0% |
| Range | 15.0% | 11.1% |
| Mean | 94.5% | 98.1% |
| Median | 94.7% | 98.1% |
| Interquartile 25% (IQ1) | 92.7% | 97.3% |
| Interquartile 75% (IQ3) | 96.0% | 100.0% |
| Interquartile Range (IQR) | 3.3% | 2.7% |
| Standard Deviation (Sample) | 3.3% | 1.8% |
| Standard Deviation (Population) | 3.3% | 1.8% |
Similar Demographics by 9th Grade
Demographics Similar to Ethiopians by 9th Grade
In terms of 9th grade, the demographic groups most similar to Ethiopians are Subsaharan African (94.4%, a difference of 0.0%), Tongan (94.4%, a difference of 0.020%), Immigrants from Sierra Leone (94.4%, a difference of 0.020%), Lumbee (94.4%, a difference of 0.030%), and Immigrants from Southern Europe (94.3%, a difference of 0.030%).
| Demographics | Rating | Rank | 9th Grade |
| Portuguese | 9.2 /100 | #218 | Tragic 94.5% |
| Africans | 9.0 /100 | #219 | Tragic 94.5% |
| Indians (Asian) | 8.6 /100 | #220 | Tragic 94.5% |
| Immigrants | Eastern Africa | 8.2 /100 | #221 | Tragic 94.5% |
| Immigrants | Asia | 7.7 /100 | #222 | Tragic 94.4% |
| Bahamians | 7.0 /100 | #223 | Tragic 94.4% |
| Tongans | 6.0 /100 | #224 | Tragic 94.4% |
| Ethiopians | 5.4 /100 | #225 | Tragic 94.4% |
| Sub-Saharan Africans | 5.4 /100 | #226 | Tragic 94.4% |
| Immigrants | Sierra Leone | 4.8 /100 | #227 | Tragic 94.4% |
| Lumbee | 4.7 /100 | #228 | Tragic 94.4% |
| Immigrants | Southern Europe | 4.5 /100 | #229 | Tragic 94.3% |
| Apache | 4.2 /100 | #230 | Tragic 94.3% |
| Immigrants | Panama | 4.0 /100 | #231 | Tragic 94.3% |
| Immigrants | Africa | 3.9 /100 | #232 | Tragic 94.3% |
Demographics Similar to Lithuanians by 9th Grade
In terms of 9th grade, the demographic groups most similar to Lithuanians are Finnish (96.6%, a difference of 0.0%), English (96.6%, a difference of 0.020%), Tlingit-Haida (96.6%, a difference of 0.040%), Danish (96.5%, a difference of 0.070%), and Scottish (96.5%, a difference of 0.070%).
| Demographics | Rating | Rank | 9th Grade |
| Slovaks | 100.0 /100 | #3 | Exceptional 96.9% |
| Slovenes | 100.0 /100 | #4 | Exceptional 96.7% |
| Swedes | 100.0 /100 | #5 | Exceptional 96.7% |
| Poles | 100.0 /100 | #6 | Exceptional 96.7% |
| Carpatho Rusyns | 100.0 /100 | #7 | Exceptional 96.7% |
| Germans | 100.0 /100 | #8 | Exceptional 96.7% |
| Tlingit-Haida | 100.0 /100 | #9 | Exceptional 96.6% |
| Lithuanians | 100.0 /100 | #10 | Exceptional 96.6% |
| Finns | 100.0 /100 | #11 | Exceptional 96.6% |
| English | 100.0 /100 | #12 | Exceptional 96.6% |
| Danes | 100.0 /100 | #13 | Exceptional 96.5% |
| Scottish | 100.0 /100 | #14 | Exceptional 96.5% |
| Irish | 100.0 /100 | #15 | Exceptional 96.5% |
| Croatians | 100.0 /100 | #16 | Exceptional 96.5% |
| Dutch | 100.0 /100 | #17 | Exceptional 96.5% |