Estonian vs Immigrants from Brazil High School Diploma
COMPARE
Estonian
Immigrants from Brazil
High School Diploma
High School Diploma Comparison
Estonians
Immigrants from Brazil
91.6%
HIGH SCHOOL DIPLOMA
99.9/ 100
METRIC RATING
22nd/ 347
METRIC RANK
89.5%
HIGH SCHOOL DIPLOMA
76.6/ 100
METRIC RATING
145th/ 347
METRIC RANK
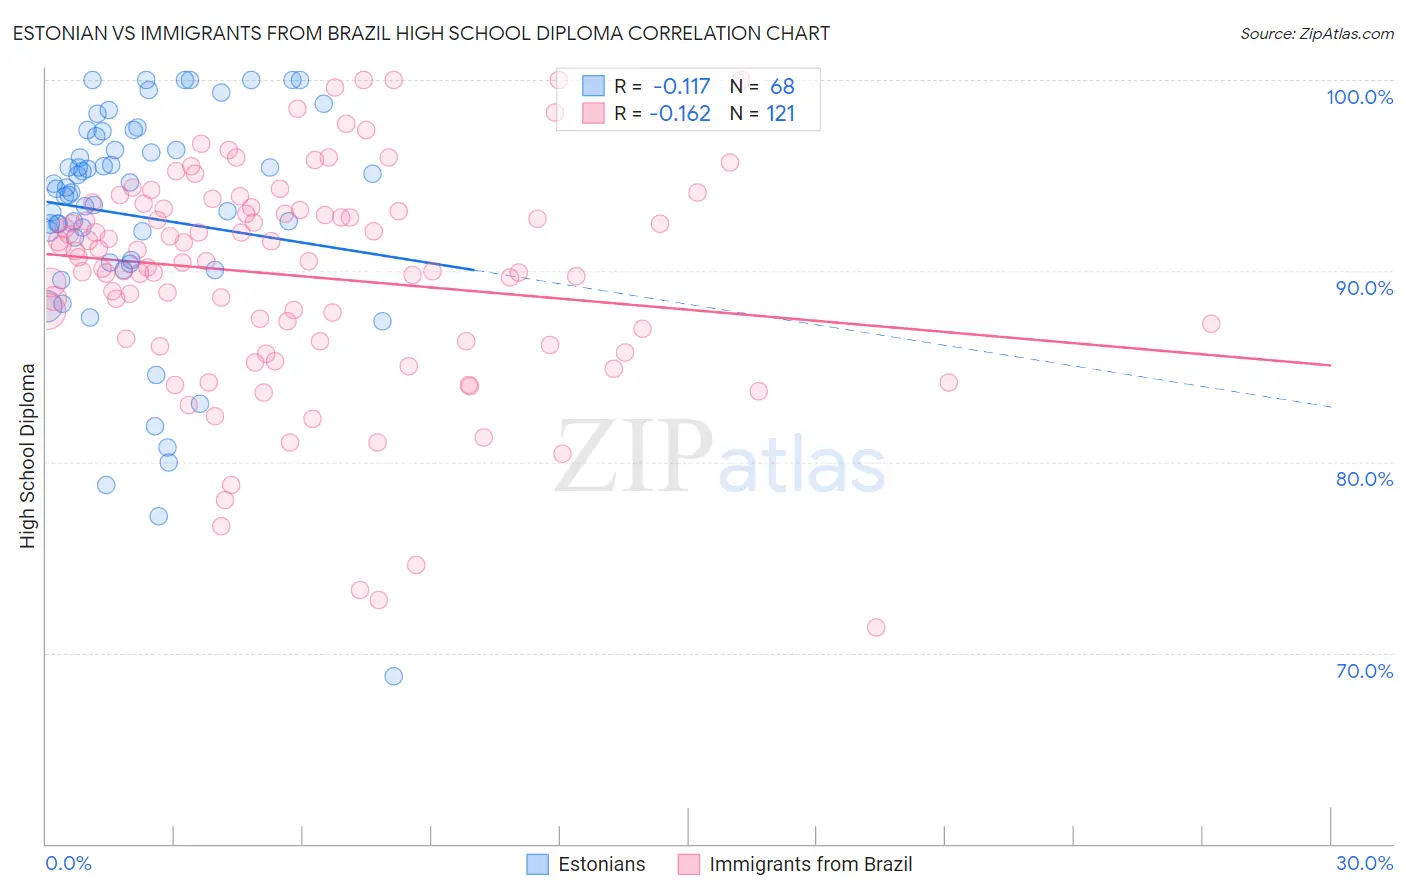
Estonian vs Immigrants from Brazil High School Diploma Correlation Chart
The statistical analysis conducted on geographies consisting of 123,527,724 people shows a poor negative correlation between the proportion of Estonians and percentage of population with at least high school diploma education in the United States with a correlation coefficient (R) of -0.117 and weighted average of 91.6%. Similarly, the statistical analysis conducted on geographies consisting of 343,021,697 people shows a poor negative correlation between the proportion of Immigrants from Brazil and percentage of population with at least high school diploma education in the United States with a correlation coefficient (R) of -0.162 and weighted average of 89.5%, a difference of 2.2%.
High School Diploma Correlation Summary
| Measurement | Estonian | Immigrants from Brazil |
| Minimum | 68.8% | 71.3% |
| Maximum | 100.0% | 100.0% |
| Range | 31.2% | 28.7% |
| Mean | 92.9% | 89.7% |
| Median | 94.2% | 90.5% |
| Interquartile 25% (IQ1) | 90.5% | 86.3% |
| Interquartile 75% (IQ3) | 96.7% | 93.2% |
| Interquartile Range (IQR) | 6.2% | 6.9% |
| Standard Deviation (Sample) | 6.1% | 5.8% |
| Standard Deviation (Population) | 6.1% | 5.8% |
Similar Demographics by High School Diploma
Demographics Similar to Estonians by High School Diploma
In terms of high school diploma, the demographic groups most similar to Estonians are Filipino (91.6%, a difference of 0.010%), Czech (91.6%, a difference of 0.020%), Scandinavian (91.5%, a difference of 0.030%), Italian (91.5%, a difference of 0.030%), and Thai (91.5%, a difference of 0.030%).
| Demographics | Rating | Rank | High School Diploma |
| Luxembourgers | 100.0 /100 | #15 | Exceptional 91.7% |
| Finns | 100.0 /100 | #16 | Exceptional 91.7% |
| Immigrants | Singapore | 99.9 /100 | #17 | Exceptional 91.7% |
| Germans | 99.9 /100 | #18 | Exceptional 91.7% |
| Maltese | 99.9 /100 | #19 | Exceptional 91.6% |
| Czechs | 99.9 /100 | #20 | Exceptional 91.6% |
| Filipinos | 99.9 /100 | #21 | Exceptional 91.6% |
| Estonians | 99.9 /100 | #22 | Exceptional 91.6% |
| Scandinavians | 99.9 /100 | #23 | Exceptional 91.5% |
| Italians | 99.9 /100 | #24 | Exceptional 91.5% |
| Thais | 99.9 /100 | #25 | Exceptional 91.5% |
| Russians | 99.9 /100 | #26 | Exceptional 91.5% |
| Cypriots | 99.9 /100 | #27 | Exceptional 91.5% |
| Tlingit-Haida | 99.9 /100 | #28 | Exceptional 91.4% |
| Europeans | 99.9 /100 | #29 | Exceptional 91.4% |
Demographics Similar to Immigrants from Brazil by High School Diploma
In terms of high school diploma, the demographic groups most similar to Immigrants from Brazil are Immigrants from Spain (89.5%, a difference of 0.010%), Immigrants from Kenya (89.6%, a difference of 0.030%), Pakistani (89.6%, a difference of 0.040%), Chilean (89.6%, a difference of 0.050%), and Indian (Asian) (89.6%, a difference of 0.050%).
| Demographics | Rating | Rank | High School Diploma |
| Assyrians/Chaldeans/Syriacs | 82.5 /100 | #138 | Excellent 89.7% |
| Kenyans | 81.4 /100 | #139 | Excellent 89.6% |
| Immigrants | Egypt | 81.2 /100 | #140 | Excellent 89.6% |
| Chileans | 79.0 /100 | #141 | Good 89.6% |
| Indians (Asian) | 78.8 /100 | #142 | Good 89.6% |
| Pakistanis | 78.3 /100 | #143 | Good 89.6% |
| Immigrants | Kenya | 78.0 /100 | #144 | Good 89.6% |
| Immigrants | Brazil | 76.6 /100 | #145 | Good 89.5% |
| Immigrants | Spain | 76.2 /100 | #146 | Good 89.5% |
| Iraqis | 73.9 /100 | #147 | Good 89.5% |
| Immigrants | Lebanon | 73.4 /100 | #148 | Good 89.5% |
| Immigrants | Poland | 72.9 /100 | #149 | Good 89.5% |
| Argentineans | 72.3 /100 | #150 | Good 89.5% |
| Paraguayans | 71.4 /100 | #151 | Good 89.5% |
| Asians | 70.7 /100 | #152 | Good 89.4% |