English vs Bolivian Associate's Degree
COMPARE
English
Bolivian
Associate's Degree
Associate's Degree Comparison
English
Bolivians
46.4%
ASSOCIATE'S DEGREE
50.0/ 100
METRIC RATING
174th/ 347
METRIC RANK
52.0%
ASSOCIATE'S DEGREE
99.8/ 100
METRIC RATING
52nd/ 347
METRIC RANK
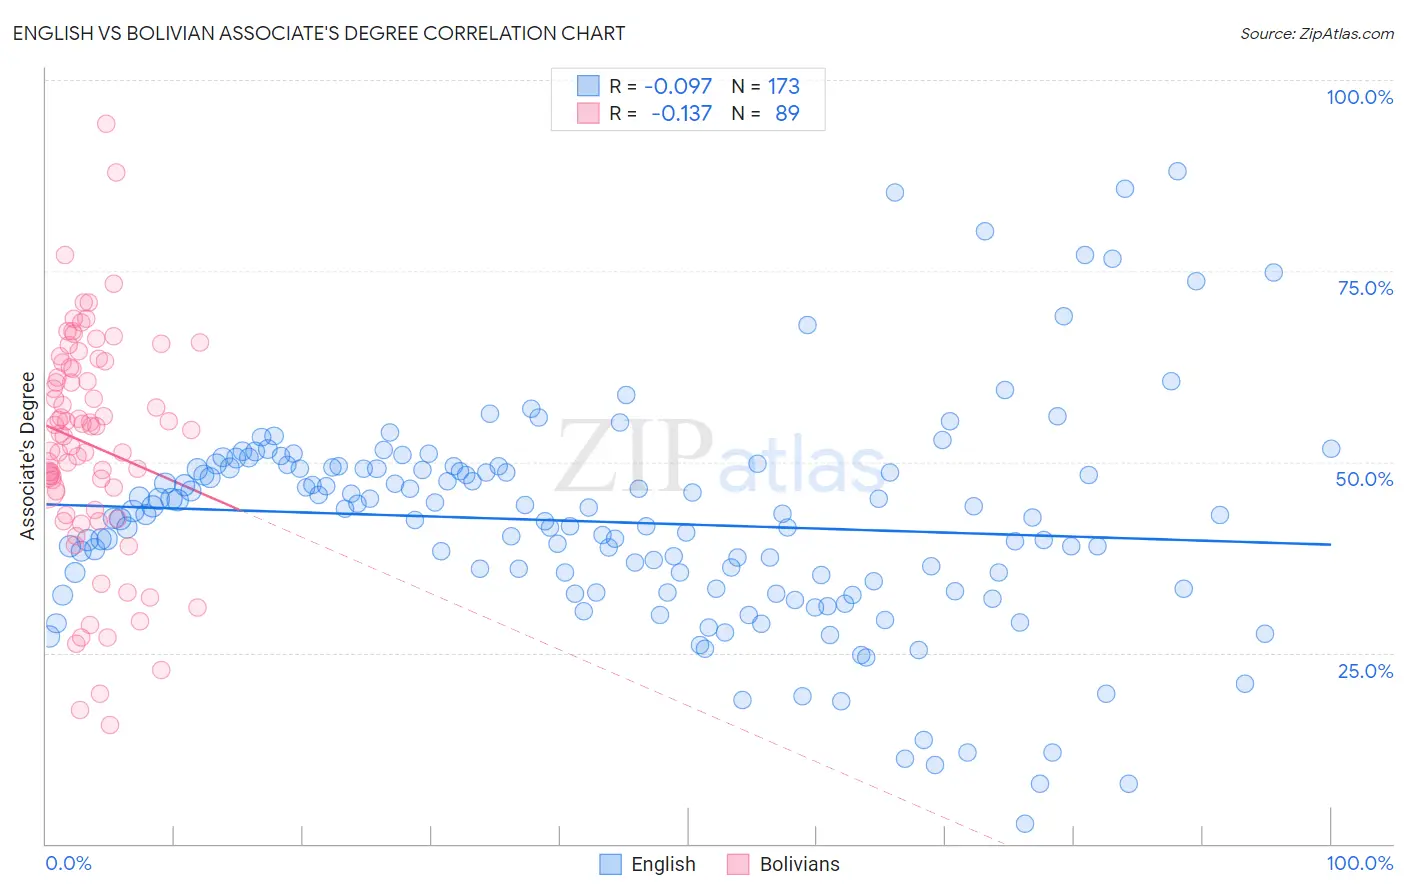
English vs Bolivian Associate's Degree Correlation Chart
The statistical analysis conducted on geographies consisting of 579,836,667 people shows a slight negative correlation between the proportion of English and percentage of population with at least associate's degree education in the United States with a correlation coefficient (R) of -0.097 and weighted average of 46.4%. Similarly, the statistical analysis conducted on geographies consisting of 184,667,780 people shows a poor negative correlation between the proportion of Bolivians and percentage of population with at least associate's degree education in the United States with a correlation coefficient (R) of -0.137 and weighted average of 52.0%, a difference of 12.1%.
Associate's Degree Correlation Summary
| Measurement | English | Bolivian |
| Minimum | 2.6% | 15.5% |
| Maximum | 88.0% | 94.2% |
| Range | 85.4% | 78.7% |
| Mean | 42.1% | 52.3% |
| Median | 43.1% | 54.2% |
| Interquartile 25% (IQ1) | 33.3% | 45.0% |
| Interquartile 75% (IQ3) | 49.2% | 62.7% |
| Interquartile Range (IQR) | 15.8% | 17.7% |
| Standard Deviation (Sample) | 14.2% | 14.7% |
| Standard Deviation (Population) | 14.2% | 14.6% |
Similar Demographics by Associate's Degree
Demographics Similar to English by Associate's Degree
In terms of associate's degree, the demographic groups most similar to English are Immigrants from Iraq (46.4%, a difference of 0.020%), Peruvian (46.4%, a difference of 0.040%), Belgian (46.3%, a difference of 0.090%), Finnish (46.3%, a difference of 0.11%), and Slovak (46.3%, a difference of 0.12%).
| Demographics | Rating | Rank | Associate's Degree |
| Immigrants | Sierra Leone | 59.2 /100 | #167 | Average 46.7% |
| Immigrants | Somalia | 55.5 /100 | #168 | Average 46.5% |
| Uruguayans | 55.4 /100 | #169 | Average 46.5% |
| Irish | 53.6 /100 | #170 | Average 46.5% |
| Basques | 52.8 /100 | #171 | Average 46.5% |
| Peruvians | 50.5 /100 | #172 | Average 46.4% |
| Immigrants | Iraq | 50.3 /100 | #173 | Average 46.4% |
| English | 50.0 /100 | #174 | Average 46.4% |
| Belgians | 48.9 /100 | #175 | Average 46.3% |
| Finns | 48.5 /100 | #176 | Average 46.3% |
| Slovaks | 48.4 /100 | #177 | Average 46.3% |
| Immigrants | Bosnia and Herzegovina | 48.3 /100 | #178 | Average 46.3% |
| Sri Lankans | 47.6 /100 | #179 | Average 46.3% |
| Bermudans | 46.4 /100 | #180 | Average 46.2% |
| Immigrants | Colombia | 41.3 /100 | #181 | Average 46.0% |
Demographics Similar to Bolivians by Associate's Degree
In terms of associate's degree, the demographic groups most similar to Bolivians are Immigrants from Asia (52.0%, a difference of 0.020%), Immigrants from Spain (51.9%, a difference of 0.13%), Australian (51.9%, a difference of 0.16%), Immigrants from Czechoslovakia (51.9%, a difference of 0.17%), and Immigrants from Greece (52.1%, a difference of 0.21%).
| Demographics | Rating | Rank | Associate's Degree |
| Immigrants | Lithuania | 99.9 /100 | #45 | Exceptional 52.4% |
| Immigrants | Bulgaria | 99.9 /100 | #46 | Exceptional 52.4% |
| Immigrants | Kuwait | 99.9 /100 | #47 | Exceptional 52.4% |
| Immigrants | Norway | 99.9 /100 | #48 | Exceptional 52.2% |
| Immigrants | Austria | 99.9 /100 | #49 | Exceptional 52.1% |
| Asians | 99.9 /100 | #50 | Exceptional 52.1% |
| Immigrants | Greece | 99.9 /100 | #51 | Exceptional 52.1% |
| Bolivians | 99.8 /100 | #52 | Exceptional 52.0% |
| Immigrants | Asia | 99.8 /100 | #53 | Exceptional 52.0% |
| Immigrants | Spain | 99.8 /100 | #54 | Exceptional 51.9% |
| Australians | 99.8 /100 | #55 | Exceptional 51.9% |
| Immigrants | Czechoslovakia | 99.8 /100 | #56 | Exceptional 51.9% |
| Paraguayans | 99.8 /100 | #57 | Exceptional 51.8% |
| New Zealanders | 99.8 /100 | #58 | Exceptional 51.8% |
| Immigrants | Serbia | 99.8 /100 | #59 | Exceptional 51.7% |