English vs Iranian Bachelor's Degree
COMPARE
English
Iranian
Bachelor's Degree
Bachelor's Degree Comparison
English
Iranians
37.4%
BACHELOR'S DEGREE
39.7/ 100
METRIC RATING
187th/ 347
METRIC RANK
51.0%
BACHELOR'S DEGREE
100.0/ 100
METRIC RATING
5th/ 347
METRIC RANK
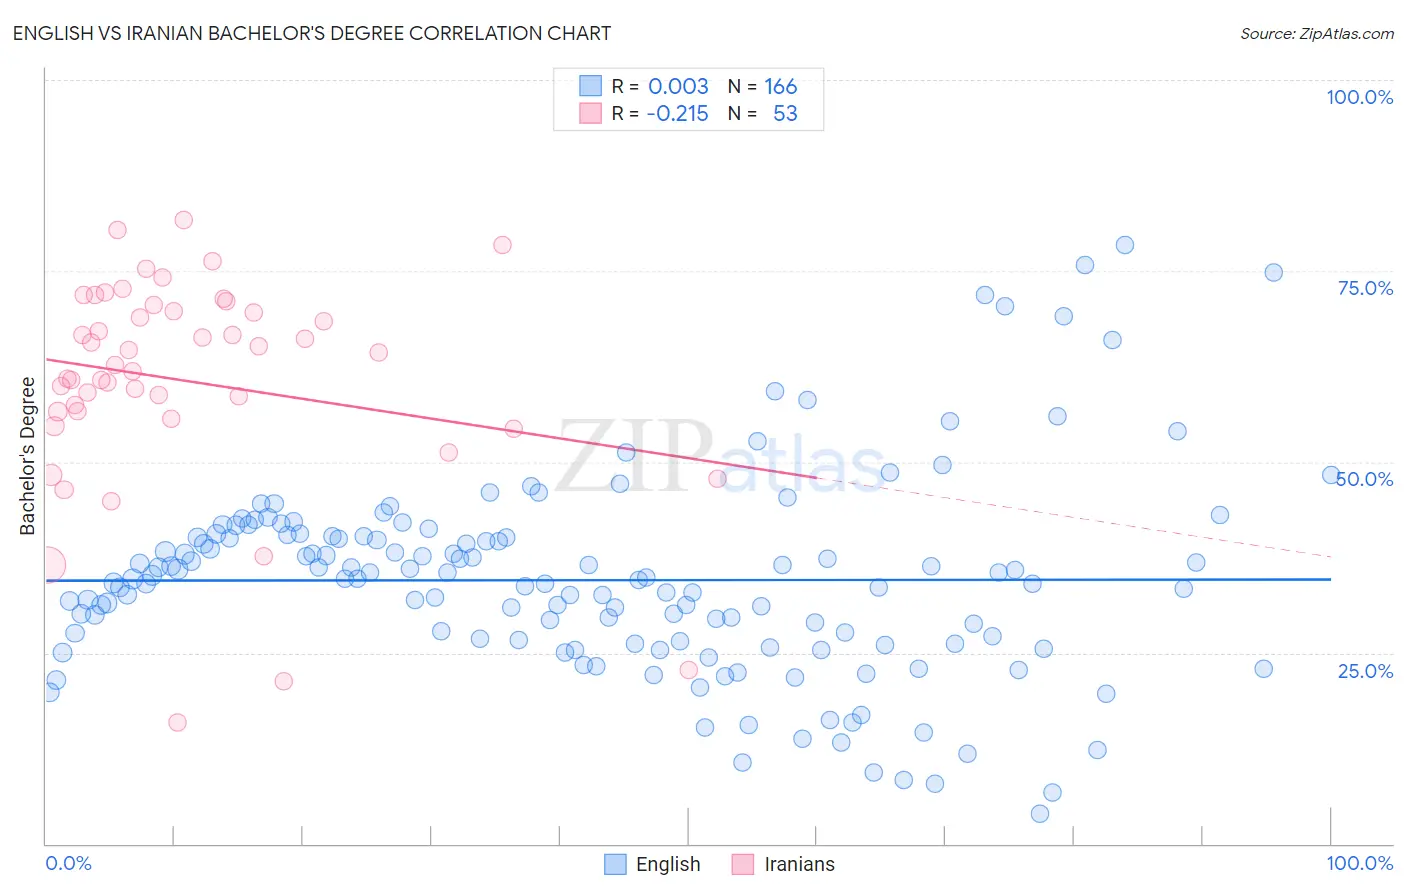
English vs Iranian Bachelor's Degree Correlation Chart
The statistical analysis conducted on geographies consisting of 579,675,473 people shows no correlation between the proportion of English and percentage of population with at least bachelor's degree education in the United States with a correlation coefficient (R) of 0.003 and weighted average of 37.4%. Similarly, the statistical analysis conducted on geographies consisting of 316,876,001 people shows a weak negative correlation between the proportion of Iranians and percentage of population with at least bachelor's degree education in the United States with a correlation coefficient (R) of -0.215 and weighted average of 51.0%, a difference of 36.1%.
Bachelor's Degree Correlation Summary
| Measurement | English | Iranian |
| Minimum | 3.9% | 15.8% |
| Maximum | 78.4% | 81.6% |
| Range | 74.5% | 65.8% |
| Mean | 34.5% | 60.5% |
| Median | 34.7% | 62.7% |
| Interquartile 25% (IQ1) | 26.5% | 56.1% |
| Interquartile 75% (IQ3) | 40.2% | 70.1% |
| Interquartile Range (IQR) | 13.8% | 14.0% |
| Standard Deviation (Sample) | 13.1% | 14.1% |
| Standard Deviation (Population) | 13.1% | 13.9% |
Similar Demographics by Bachelor's Degree
Demographics Similar to English by Bachelor's Degree
In terms of bachelor's degree, the demographic groups most similar to English are Norwegian (37.5%, a difference of 0.070%), Immigrants from Peru (37.5%, a difference of 0.17%), Scandinavian (37.5%, a difference of 0.21%), Immigrants from Oceania (37.3%, a difference of 0.24%), and Senegalese (37.5%, a difference of 0.26%).
| Demographics | Rating | Rank | Bachelor's Degree |
| Irish | 44.3 /100 | #180 | Average 37.6% |
| Immigrants | Senegal | 43.8 /100 | #181 | Average 37.6% |
| Immigrants | Bosnia and Herzegovina | 43.4 /100 | #182 | Average 37.6% |
| Senegalese | 42.2 /100 | #183 | Average 37.5% |
| Scandinavians | 41.7 /100 | #184 | Average 37.5% |
| Immigrants | Peru | 41.3 /100 | #185 | Average 37.5% |
| Norwegians | 40.4 /100 | #186 | Average 37.5% |
| English | 39.7 /100 | #187 | Fair 37.4% |
| Immigrants | Oceania | 37.3 /100 | #188 | Fair 37.3% |
| Slovaks | 36.9 /100 | #189 | Fair 37.3% |
| Swiss | 34.1 /100 | #190 | Fair 37.2% |
| Nigerians | 33.9 /100 | #191 | Fair 37.2% |
| Immigrants | Vietnam | 32.1 /100 | #192 | Fair 37.1% |
| Yugoslavians | 31.5 /100 | #193 | Fair 37.1% |
| Belgians | 29.9 /100 | #194 | Fair 37.0% |
Demographics Similar to Iranians by Bachelor's Degree
In terms of bachelor's degree, the demographic groups most similar to Iranians are Immigrants from Taiwan (51.2%, a difference of 0.42%), Immigrants from India (51.3%, a difference of 0.63%), Okinawan (50.5%, a difference of 0.84%), Immigrants from Iran (50.3%, a difference of 1.3%), and Thai (50.1%, a difference of 1.7%).
| Demographics | Rating | Rank | Bachelor's Degree |
| Filipinos | 100.0 /100 | #1 | Exceptional 52.7% |
| Immigrants | Singapore | 100.0 /100 | #2 | Exceptional 51.9% |
| Immigrants | India | 100.0 /100 | #3 | Exceptional 51.3% |
| Immigrants | Taiwan | 100.0 /100 | #4 | Exceptional 51.2% |
| Iranians | 100.0 /100 | #5 | Exceptional 51.0% |
| Okinawans | 100.0 /100 | #6 | Exceptional 50.5% |
| Immigrants | Iran | 100.0 /100 | #7 | Exceptional 50.3% |
| Thais | 100.0 /100 | #8 | Exceptional 50.1% |
| Immigrants | Israel | 100.0 /100 | #9 | Exceptional 50.0% |
| Cypriots | 100.0 /100 | #10 | Exceptional 49.0% |
| Immigrants | Australia | 100.0 /100 | #11 | Exceptional 48.5% |
| Immigrants | China | 100.0 /100 | #12 | Exceptional 48.4% |
| Immigrants | South Central Asia | 100.0 /100 | #13 | Exceptional 48.3% |
| Immigrants | Hong Kong | 100.0 /100 | #14 | Exceptional 48.2% |
| Immigrants | Eastern Asia | 100.0 /100 | #15 | Exceptional 48.1% |