French Canadian vs Iranian Bachelor's Degree
COMPARE
French Canadian
Iranian
Bachelor's Degree
Bachelor's Degree Comparison
French Canadians
Iranians
35.6%
BACHELOR'S DEGREE
8.3/ 100
METRIC RATING
223rd/ 347
METRIC RANK
51.0%
BACHELOR'S DEGREE
100.0/ 100
METRIC RATING
5th/ 347
METRIC RANK
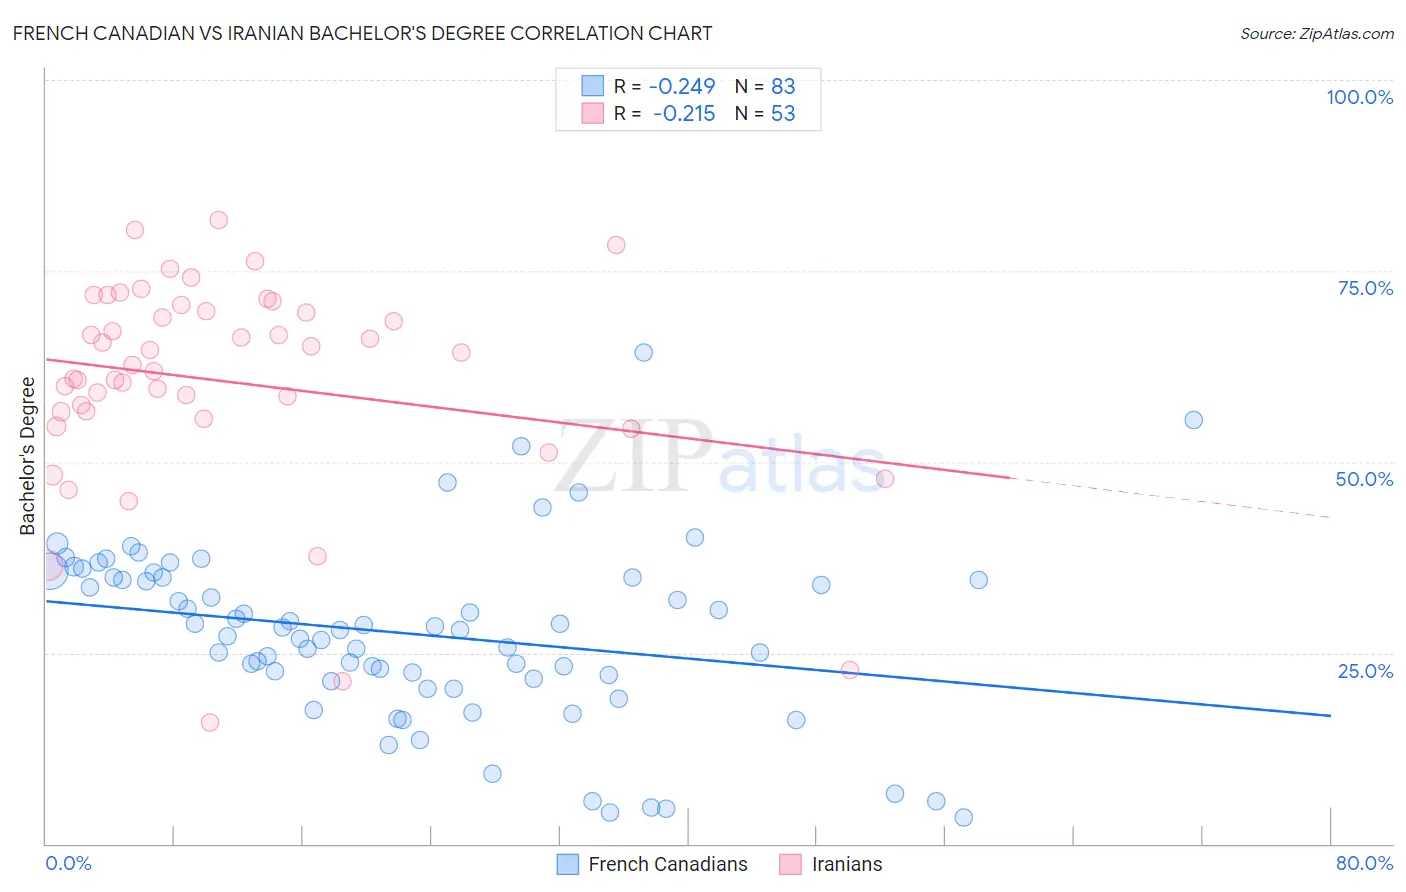
French Canadian vs Iranian Bachelor's Degree Correlation Chart
The statistical analysis conducted on geographies consisting of 502,615,411 people shows a weak negative correlation between the proportion of French Canadians and percentage of population with at least bachelor's degree education in the United States with a correlation coefficient (R) of -0.249 and weighted average of 35.6%. Similarly, the statistical analysis conducted on geographies consisting of 316,876,001 people shows a weak negative correlation between the proportion of Iranians and percentage of population with at least bachelor's degree education in the United States with a correlation coefficient (R) of -0.215 and weighted average of 51.0%, a difference of 43.1%.
Bachelor's Degree Correlation Summary
| Measurement | French Canadian | Iranian |
| Minimum | 3.4% | 15.8% |
| Maximum | 64.3% | 81.6% |
| Range | 60.9% | 65.8% |
| Mean | 27.5% | 60.5% |
| Median | 28.0% | 62.7% |
| Interquartile 25% (IQ1) | 21.6% | 56.1% |
| Interquartile 75% (IQ3) | 34.8% | 70.1% |
| Interquartile Range (IQR) | 13.2% | 14.0% |
| Standard Deviation (Sample) | 11.6% | 14.1% |
| Standard Deviation (Population) | 11.5% | 13.9% |
Similar Demographics by Bachelor's Degree
Demographics Similar to French Canadians by Bachelor's Degree
In terms of bachelor's degree, the demographic groups most similar to French Canadians are Trinidadian and Tobagonian (35.7%, a difference of 0.18%), Immigrants from Barbados (35.5%, a difference of 0.28%), Dutch (35.7%, a difference of 0.32%), Immigrants from Burma/Myanmar (35.5%, a difference of 0.35%), and Portuguese (35.5%, a difference of 0.38%).
| Demographics | Rating | Rank | Bachelor's Degree |
| Barbadians | 13.5 /100 | #216 | Poor 36.1% |
| German Russians | 10.2 /100 | #217 | Poor 35.8% |
| Sub-Saharan Africans | 9.8 /100 | #218 | Tragic 35.8% |
| West Indians | 9.7 /100 | #219 | Tragic 35.8% |
| Spanish | 9.6 /100 | #220 | Tragic 35.8% |
| Dutch | 9.2 /100 | #221 | Tragic 35.7% |
| Trinidadians and Tobagonians | 8.8 /100 | #222 | Tragic 35.7% |
| French Canadians | 8.3 /100 | #223 | Tragic 35.6% |
| Immigrants | Barbados | 7.5 /100 | #224 | Tragic 35.5% |
| Immigrants | Burma/Myanmar | 7.3 /100 | #225 | Tragic 35.5% |
| Portuguese | 7.2 /100 | #226 | Tragic 35.5% |
| Ecuadorians | 6.6 /100 | #227 | Tragic 35.4% |
| Immigrants | Trinidad and Tobago | 6.0 /100 | #228 | Tragic 35.3% |
| Whites/Caucasians | 5.9 /100 | #229 | Tragic 35.3% |
| Immigrants | Grenada | 4.3 /100 | #230 | Tragic 35.0% |
Demographics Similar to Iranians by Bachelor's Degree
In terms of bachelor's degree, the demographic groups most similar to Iranians are Immigrants from Taiwan (51.2%, a difference of 0.42%), Immigrants from India (51.3%, a difference of 0.63%), Okinawan (50.5%, a difference of 0.84%), Immigrants from Iran (50.3%, a difference of 1.3%), and Thai (50.1%, a difference of 1.7%).
| Demographics | Rating | Rank | Bachelor's Degree |
| Filipinos | 100.0 /100 | #1 | Exceptional 52.7% |
| Immigrants | Singapore | 100.0 /100 | #2 | Exceptional 51.9% |
| Immigrants | India | 100.0 /100 | #3 | Exceptional 51.3% |
| Immigrants | Taiwan | 100.0 /100 | #4 | Exceptional 51.2% |
| Iranians | 100.0 /100 | #5 | Exceptional 51.0% |
| Okinawans | 100.0 /100 | #6 | Exceptional 50.5% |
| Immigrants | Iran | 100.0 /100 | #7 | Exceptional 50.3% |
| Thais | 100.0 /100 | #8 | Exceptional 50.1% |
| Immigrants | Israel | 100.0 /100 | #9 | Exceptional 50.0% |
| Cypriots | 100.0 /100 | #10 | Exceptional 49.0% |
| Immigrants | Australia | 100.0 /100 | #11 | Exceptional 48.5% |
| Immigrants | China | 100.0 /100 | #12 | Exceptional 48.4% |
| Immigrants | South Central Asia | 100.0 /100 | #13 | Exceptional 48.3% |
| Immigrants | Hong Kong | 100.0 /100 | #14 | Exceptional 48.2% |
| Immigrants | Eastern Asia | 100.0 /100 | #15 | Exceptional 48.1% |