English vs Iranian 8th Grade
COMPARE
English
Iranian
8th Grade
8th Grade Comparison
English
Iranians
97.3%
8TH GRADE
100.0/ 100
METRIC RATING
14th/ 347
METRIC RANK
96.6%
8TH GRADE
99.7/ 100
METRIC RATING
67th/ 347
METRIC RANK
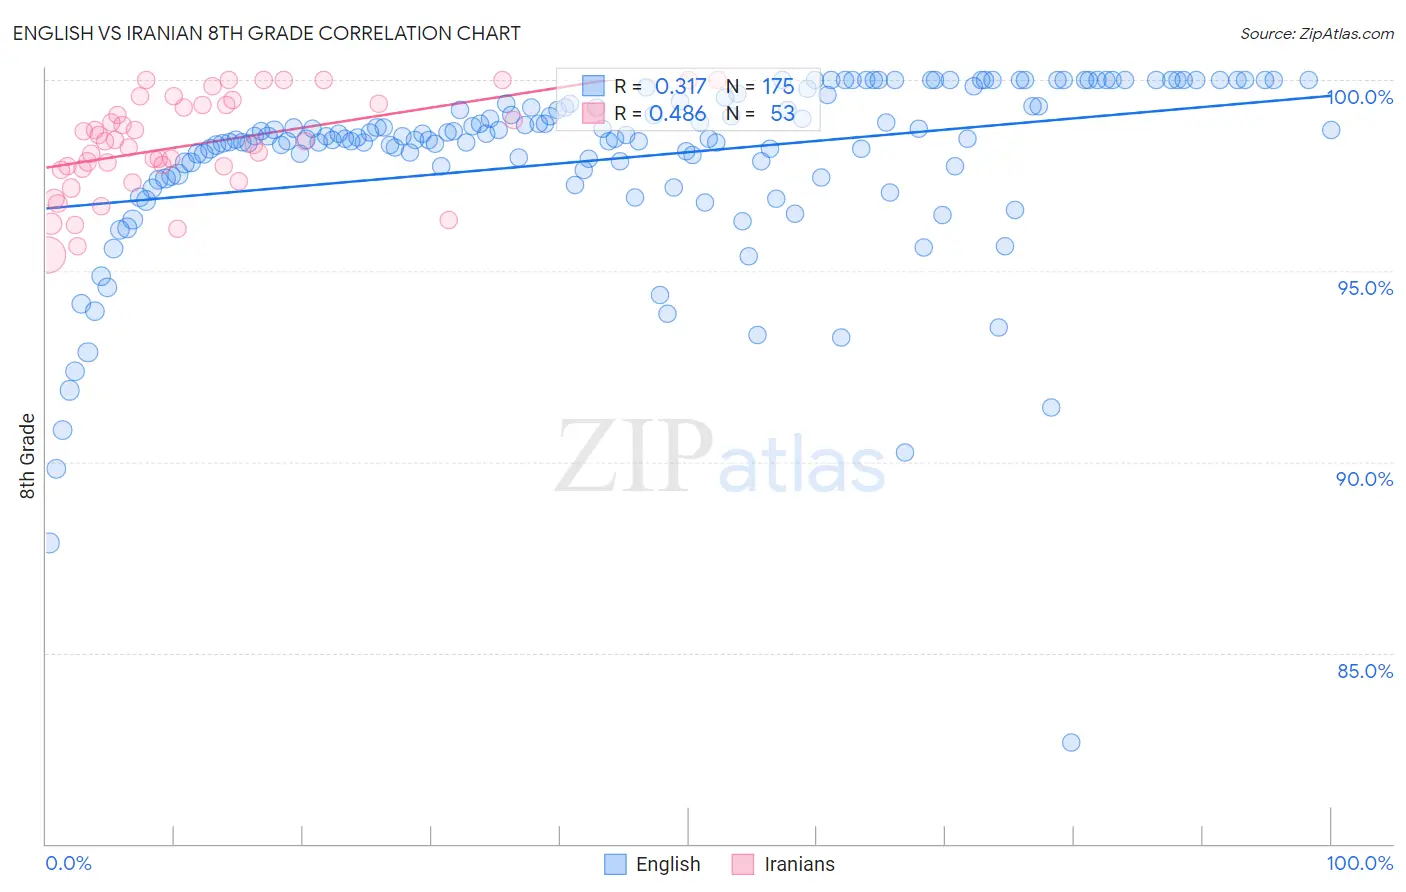
English vs Iranian 8th Grade Correlation Chart
The statistical analysis conducted on geographies consisting of 579,981,193 people shows a mild positive correlation between the proportion of English and percentage of population with at least 8th grade education in the United States with a correlation coefficient (R) of 0.317 and weighted average of 97.3%. Similarly, the statistical analysis conducted on geographies consisting of 310,636,461 people shows a moderate positive correlation between the proportion of Iranians and percentage of population with at least 8th grade education in the United States with a correlation coefficient (R) of 0.486 and weighted average of 96.6%, a difference of 0.72%.
8th Grade Correlation Summary
| Measurement | English | Iranian |
| Minimum | 82.6% | 95.4% |
| Maximum | 100.0% | 100.0% |
| Range | 17.4% | 4.6% |
| Mean | 97.9% | 98.3% |
| Median | 98.5% | 98.4% |
| Interquartile 25% (IQ1) | 97.7% | 97.7% |
| Interquartile 75% (IQ3) | 99.4% | 99.4% |
| Interquartile Range (IQR) | 1.7% | 1.7% |
| Standard Deviation (Sample) | 2.5% | 1.3% |
| Standard Deviation (Population) | 2.5% | 1.2% |
Similar Demographics by 8th Grade
Demographics Similar to English by 8th Grade
In terms of 8th grade, the demographic groups most similar to English are Alaskan Athabascan (97.3%, a difference of 0.0%), Pennsylvania German (97.3%, a difference of 0.010%), Tlingit-Haida (97.3%, a difference of 0.040%), Irish (97.3%, a difference of 0.050%), and Lithuanian (97.3%, a difference of 0.060%).
| Demographics | Rating | Rank | 8th Grade |
| Norwegians | 100.0 /100 | #7 | Exceptional 97.6% |
| Slovaks | 100.0 /100 | #8 | Exceptional 97.6% |
| Germans | 100.0 /100 | #9 | Exceptional 97.5% |
| Slovenes | 100.0 /100 | #10 | Exceptional 97.5% |
| Poles | 100.0 /100 | #11 | Exceptional 97.4% |
| Swedes | 100.0 /100 | #12 | Exceptional 97.4% |
| Alaskan Athabascans | 100.0 /100 | #13 | Exceptional 97.3% |
| English | 100.0 /100 | #14 | Exceptional 97.3% |
| Pennsylvania Germans | 100.0 /100 | #15 | Exceptional 97.3% |
| Tlingit-Haida | 100.0 /100 | #16 | Exceptional 97.3% |
| Irish | 100.0 /100 | #17 | Exceptional 97.3% |
| Lithuanians | 100.0 /100 | #18 | Exceptional 97.3% |
| Scottish | 100.0 /100 | #19 | Exceptional 97.3% |
| Croatians | 100.0 /100 | #20 | Exceptional 97.2% |
| Danes | 100.0 /100 | #21 | Exceptional 97.2% |
Demographics Similar to Iranians by 8th Grade
In terms of 8th grade, the demographic groups most similar to Iranians are Ukrainian (96.7%, a difference of 0.010%), Immigrants from India (96.6%, a difference of 0.010%), Native Hawaiian (96.6%, a difference of 0.010%), Canadian (96.6%, a difference of 0.010%), and Creek (96.6%, a difference of 0.010%).
| Demographics | Rating | Rank | 8th Grade |
| Immigrants | Northern Europe | 99.8 /100 | #60 | Exceptional 96.7% |
| Immigrants | Austria | 99.8 /100 | #61 | Exceptional 96.7% |
| Whites/Caucasians | 99.8 /100 | #62 | Exceptional 96.7% |
| Ukrainians | 99.7 /100 | #63 | Exceptional 96.7% |
| Immigrants | India | 99.7 /100 | #64 | Exceptional 96.6% |
| Native Hawaiians | 99.7 /100 | #65 | Exceptional 96.6% |
| Canadians | 99.7 /100 | #66 | Exceptional 96.6% |
| Iranians | 99.7 /100 | #67 | Exceptional 96.6% |
| Creek | 99.7 /100 | #68 | Exceptional 96.6% |
| Americans | 99.7 /100 | #69 | Exceptional 96.6% |
| Immigrants | Lithuania | 99.6 /100 | #70 | Exceptional 96.6% |
| New Zealanders | 99.5 /100 | #71 | Exceptional 96.6% |
| Immigrants | England | 99.5 /100 | #72 | Exceptional 96.6% |
| Arapaho | 99.5 /100 | #73 | Exceptional 96.6% |
| Immigrants | Ireland | 99.5 /100 | #74 | Exceptional 96.5% |