Immigrants from Lithuania vs Iranian Bachelor's Degree
COMPARE
Immigrants from Lithuania
Iranian
Bachelor's Degree
Bachelor's Degree Comparison
Immigrants from Lithuania
Iranians
44.6%
BACHELOR'S DEGREE
99.9/ 100
METRIC RATING
44th/ 347
METRIC RANK
51.0%
BACHELOR'S DEGREE
100.0/ 100
METRIC RATING
5th/ 347
METRIC RANK
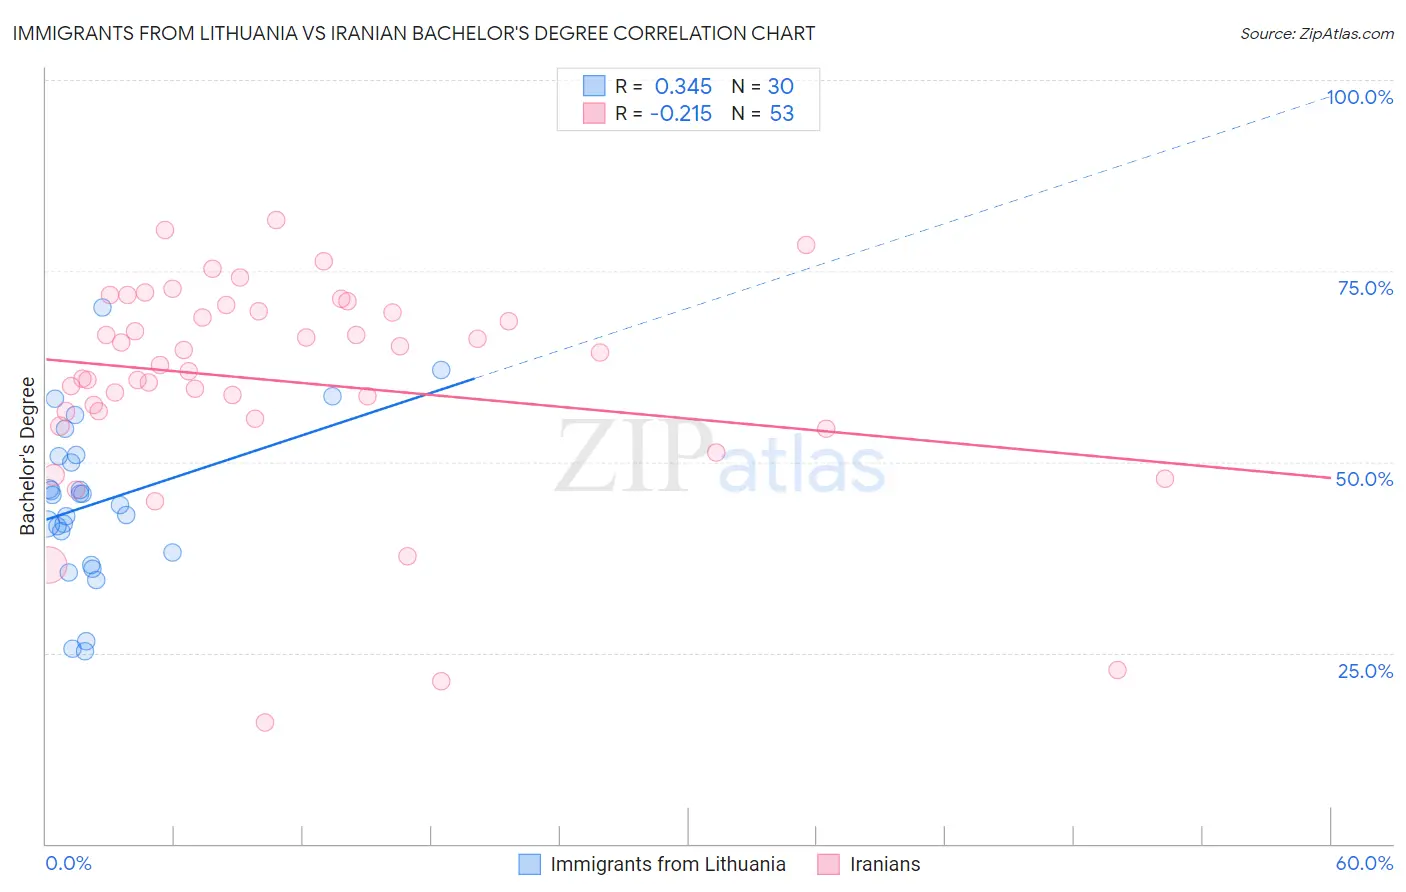
Immigrants from Lithuania vs Iranian Bachelor's Degree Correlation Chart
The statistical analysis conducted on geographies consisting of 117,722,731 people shows a mild positive correlation between the proportion of Immigrants from Lithuania and percentage of population with at least bachelor's degree education in the United States with a correlation coefficient (R) of 0.345 and weighted average of 44.6%. Similarly, the statistical analysis conducted on geographies consisting of 316,876,001 people shows a weak negative correlation between the proportion of Iranians and percentage of population with at least bachelor's degree education in the United States with a correlation coefficient (R) of -0.215 and weighted average of 51.0%, a difference of 14.2%.
Bachelor's Degree Correlation Summary
| Measurement | Immigrants from Lithuania | Iranian |
| Minimum | 25.2% | 15.8% |
| Maximum | 70.2% | 81.6% |
| Range | 45.0% | 65.8% |
| Mean | 44.7% | 60.5% |
| Median | 45.0% | 62.7% |
| Interquartile 25% (IQ1) | 38.1% | 56.1% |
| Interquartile 75% (IQ3) | 50.7% | 70.1% |
| Interquartile Range (IQR) | 12.6% | 14.0% |
| Standard Deviation (Sample) | 10.5% | 14.1% |
| Standard Deviation (Population) | 10.3% | 13.9% |
Similar Demographics by Bachelor's Degree
Demographics Similar to Immigrants from Lithuania by Bachelor's Degree
In terms of bachelor's degree, the demographic groups most similar to Immigrants from Lithuania are Immigrants from Kuwait (44.6%, a difference of 0.030%), Immigrants from Bulgaria (44.6%, a difference of 0.080%), Bolivian (44.6%, a difference of 0.12%), Estonian (44.6%, a difference of 0.12%), and Immigrants from Norway (44.5%, a difference of 0.25%).
| Demographics | Rating | Rank | Bachelor's Degree |
| Russians | 100.0 /100 | #37 | Exceptional 45.3% |
| Bulgarians | 100.0 /100 | #38 | Exceptional 45.3% |
| Immigrants | Latvia | 100.0 /100 | #39 | Exceptional 45.1% |
| Immigrants | Belarus | 100.0 /100 | #40 | Exceptional 45.0% |
| Immigrants | Malaysia | 100.0 /100 | #41 | Exceptional 45.0% |
| Immigrants | Saudi Arabia | 100.0 /100 | #42 | Exceptional 44.8% |
| Immigrants | South Africa | 99.9 /100 | #43 | Exceptional 44.8% |
| Immigrants | Lithuania | 99.9 /100 | #44 | Exceptional 44.6% |
| Immigrants | Kuwait | 99.9 /100 | #45 | Exceptional 44.6% |
| Immigrants | Bulgaria | 99.9 /100 | #46 | Exceptional 44.6% |
| Bolivians | 99.9 /100 | #47 | Exceptional 44.6% |
| Estonians | 99.9 /100 | #48 | Exceptional 44.6% |
| Immigrants | Norway | 99.9 /100 | #49 | Exceptional 44.5% |
| Immigrants | Greece | 99.9 /100 | #50 | Exceptional 44.5% |
| Asians | 99.9 /100 | #51 | Exceptional 44.4% |
Demographics Similar to Iranians by Bachelor's Degree
In terms of bachelor's degree, the demographic groups most similar to Iranians are Immigrants from Taiwan (51.2%, a difference of 0.42%), Immigrants from India (51.3%, a difference of 0.63%), Okinawan (50.5%, a difference of 0.84%), Immigrants from Iran (50.3%, a difference of 1.3%), and Thai (50.1%, a difference of 1.7%).
| Demographics | Rating | Rank | Bachelor's Degree |
| Filipinos | 100.0 /100 | #1 | Exceptional 52.7% |
| Immigrants | Singapore | 100.0 /100 | #2 | Exceptional 51.9% |
| Immigrants | India | 100.0 /100 | #3 | Exceptional 51.3% |
| Immigrants | Taiwan | 100.0 /100 | #4 | Exceptional 51.2% |
| Iranians | 100.0 /100 | #5 | Exceptional 51.0% |
| Okinawans | 100.0 /100 | #6 | Exceptional 50.5% |
| Immigrants | Iran | 100.0 /100 | #7 | Exceptional 50.3% |
| Thais | 100.0 /100 | #8 | Exceptional 50.1% |
| Immigrants | Israel | 100.0 /100 | #9 | Exceptional 50.0% |
| Cypriots | 100.0 /100 | #10 | Exceptional 49.0% |
| Immigrants | Australia | 100.0 /100 | #11 | Exceptional 48.5% |
| Immigrants | China | 100.0 /100 | #12 | Exceptional 48.4% |
| Immigrants | South Central Asia | 100.0 /100 | #13 | Exceptional 48.3% |
| Immigrants | Hong Kong | 100.0 /100 | #14 | Exceptional 48.2% |
| Immigrants | Eastern Asia | 100.0 /100 | #15 | Exceptional 48.1% |