Egyptian vs Inupiat Doctorate Degree

COMPARE

Egyptian
Race
Ancestry
AfghanAfricanAlaska NativeAlaskan AthabascanAlbanianAleutAlsatianAmericanApacheArabArapahoArgentineanArmenianAssyrian/Chaldean/SyriacAustralianAustrianBahamianBangladeshiBarbadianBasqueBelgianBelizeanBermudanBhutaneseBlackfeetBolivianBrazilianBritishBritish West IndianBulgarianBurmeseCajunCambodianCanadianCape VerdeanCarpatho RusynCelticCentral AmericanCentral American IndianCherokeeCheyenneChickasawChileanChineseChippewaChoctawColombianColvilleComancheCosta RicanCreeCreekCroatianCrowCubanCypriotCzechCzechoslovakianDanishDelawareDominicanDutchDutch West IndianEastern EuropeanEcuadorianEgyptianEnglishEstonianEthiopianEuropeanFijianFilipinoFinnishFrenchFrench American IndianFrench CanadianGermanGerman RussianGhanaianGreekGuamanian/ChamorroGuatemalanGuyaneseHaitianHmongHonduranHopiHoumaHungarianIcelanderIndian (Asian)IndonesianIranianIraqiIrishIroquoisIsraeliItalianJamaicanJapaneseJordanianKenyanKiowaKoreanLaotianLatvianLebaneseLiberianLithuanianLumbeeLuxembourgerMacedonianMalaysianMalteseMarshalleseMenomineeMexicanMexican American IndianMongolianMoroccanNative HawaiianNavajoNepaleseNew ZealanderNicaraguanNigerianNorthern EuropeanNorwegianOkinawanOsageOttawaPaiutePakistaniPalestinianPanamanianParaguayanPennsylvania GermanPeruvianPimaPolishPortuguesePotawatomiPuebloPuerto RicanPuget Sound SalishRomanianRussianSalvadoranSamoanScandinavianScotch-IrishScottishSeminoleSenegaleseSerbianShoshoneSierra LeoneanSiouxSlavicSlovakSloveneSomaliSouth AfricanSouth AmericanSouth American IndianSoviet UnionSpaniardSpanishSpanish AmericanSpanish American IndianSri LankanSubsaharan AfricanSudaneseSwedishSwissSyrianTaiwaneseThaiTlingit-HaidaTohono O'OdhamTonganTrinidadian and TobagonianTsimshianTurkishU.S. Virgin IslanderUgandanUkrainianUruguayanUteVenezuelanVietnameseWelshWest IndianYakamaYaquiYugoslavianYumanYup'ikZimbabwean
Immigration
NonimmigrantsImmigrantsAfghanistanAfricaAlbaniaArgentinaArmeniaAsiaAustraliaAustriaBahamasBangladeshBarbadosBelarusBelgiumBelizeBoliviaBosnia and HerzegovinaBrazilBulgariaBurma/MyanmarCabo VerdeCambodiaCameroonCanadaCaribbeanCentral AmericaChileChinaColombiaCongoCosta RicaCroatiaCubaCzechoslovakiaDenmarkDominicaDominican RepublicEastern AfricaEastern AsiaEastern EuropeEcuadorEgyptEl SalvadorEnglandEritreaEthiopiaEuropeFijiFranceGermanyGhanaGreeceGrenadaGuatemalaGuyanaHaitiHondurasHong KongHungaryIndiaIndonesiaIranIraqIrelandIsraelItalyJamaicaJapanJordanKazakhstanKenyaKoreaKuwaitLaosLatin AmericaLatviaLebanonLiberiaLithuaniaMalaysiaMexicoMicronesiaMiddle AfricaMoldovaMoroccoNepalNetherlandsNicaraguaNigeriaNorth AmericaNorth MacedoniaNorthern AfricaNorthern EuropeNorwayOceaniaPakistanPanamaPeruPhilippinesPolandPortugalRomaniaRussiaSaudi ArabiaScotlandSenegalSerbiaSierra LeoneSingaporeSomaliaSouth AfricaSouth AmericaSouth Central AsiaSouth Eastern AsiaSouthern EuropeSpainSri LankaSt. Vincent and the GrenadinesSudanSwedenSwitzerlandSyriaTaiwanThailandTrinidad and TobagoTurkeyUgandaUkraineUruguayUzbekistanVenezuelaVietnamWest IndiesWestern AfricaWestern AsiaWestern EuropeYemenZaireZimbabweAzores
Inupiat
Race
Ancestry
AfghanAfricanAlaska NativeAlaskan AthabascanAlbanianAleutAlsatianAmericanApacheArabArapahoArgentineanArmenianAssyrian/Chaldean/SyriacAustralianAustrianBahamianBangladeshiBarbadianBasqueBelgianBelizeanBermudanBhutaneseBlackfeetBolivianBrazilianBritishBritish West IndianBulgarianBurmeseCajunCambodianCanadianCape VerdeanCarpatho RusynCelticCentral AmericanCentral American IndianCherokeeCheyenneChickasawChileanChineseChippewaChoctawColombianColvilleComancheCosta RicanCreeCreekCroatianCrowCubanCypriotCzechCzechoslovakianDanishDelawareDominicanDutchDutch West IndianEastern EuropeanEcuadorianEnglishEstonianEthiopianEuropeanFijianFilipinoFinnishFrenchFrench American IndianFrench CanadianGermanGerman RussianGhanaianGreekGuamanian/ChamorroGuatemalanGuyaneseHaitianHmongHonduranHopiHoumaHungarianIcelanderIndian (Asian)IndonesianInupiatIranianIraqiIrishIroquoisIsraeliItalianJamaicanJapaneseJordanianKenyanKiowaKoreanLaotianLatvianLebaneseLiberianLithuanianLumbeeLuxembourgerMacedonianMalaysianMalteseMarshalleseMenomineeMexicanMexican American IndianMongolianMoroccanNative HawaiianNavajoNepaleseNew ZealanderNicaraguanNigerianNorthern EuropeanNorwegianOkinawanOsageOttawaPaiutePakistaniPalestinianPanamanianParaguayanPennsylvania GermanPeruvianPimaPolishPortuguesePotawatomiPuebloPuerto RicanPuget Sound SalishRomanianRussianSalvadoranSamoanScandinavianScotch-IrishScottishSeminoleSenegaleseSerbianShoshoneSierra LeoneanSiouxSlavicSlovakSloveneSomaliSouth AfricanSouth AmericanSouth American IndianSoviet UnionSpaniardSpanishSpanish AmericanSpanish American IndianSri LankanSubsaharan AfricanSudaneseSwedishSwissSyrianTaiwaneseThaiTlingit-HaidaTohono O'OdhamTonganTrinidadian and TobagonianTsimshianTurkishU.S. Virgin IslanderUgandanUkrainianUruguayanUteVenezuelanVietnameseWelshWest IndianYakamaYaquiYugoslavianYumanYup'ikZimbabwean
Immigration
NonimmigrantsImmigrantsAfghanistanAfricaAlbaniaArgentinaArmeniaAsiaAustraliaAustriaBahamasBangladeshBarbadosBelarusBelgiumBelizeBoliviaBosnia and HerzegovinaBrazilBulgariaBurma/MyanmarCabo VerdeCambodiaCameroonCanadaCaribbeanCentral AmericaChileChinaColombiaCongoCosta RicaCroatiaCubaCzechoslovakiaDenmarkDominicaDominican RepublicEastern AfricaEastern AsiaEastern EuropeEcuadorEgyptEl SalvadorEnglandEritreaEthiopiaEuropeFijiFranceGermanyGhanaGreeceGrenadaGuatemalaGuyanaHaitiHondurasHong KongHungaryIndiaIndonesiaIranIraqIrelandIsraelItalyJamaicaJapanJordanKazakhstanKenyaKoreaKuwaitLaosLatin AmericaLatviaLebanonLiberiaLithuaniaMalaysiaMexicoMicronesiaMiddle AfricaMoldovaMoroccoNepalNetherlandsNicaraguaNigeriaNorth AmericaNorth MacedoniaNorthern AfricaNorthern EuropeNorwayOceaniaPakistanPanamaPeruPhilippinesPolandPortugalRomaniaRussiaSaudi ArabiaScotlandSenegalSerbiaSierra LeoneSingaporeSomaliaSouth AfricaSouth AmericaSouth Central AsiaSouth Eastern AsiaSouthern EuropeSpainSri LankaSt. Vincent and the GrenadinesSudanSwedenSwitzerlandSyriaTaiwanThailandTrinidad and TobagoTurkeyUgandaUkraineUruguayUzbekistanVenezuelaVietnamWest IndiesWestern AfricaWestern AsiaWestern EuropeYemenZaireZimbabweAzores
Doctorate Degree
Income
Poverty
Unemployment
Labor Participation
Family Structure
Vehicle Availability
Education Level
Disability

Doctorate Degree Comparison

Egyptians

Inupiat

Exceptional
Tragic
2.2%
DOCTORATE DEGREE
99.4/ 100
METRIC RATING
86th/ 347
METRIC RANK
1.3%
DOCTORATE DEGREE
0.0/ 100
METRIC RATING
328th/ 347
METRIC RANK

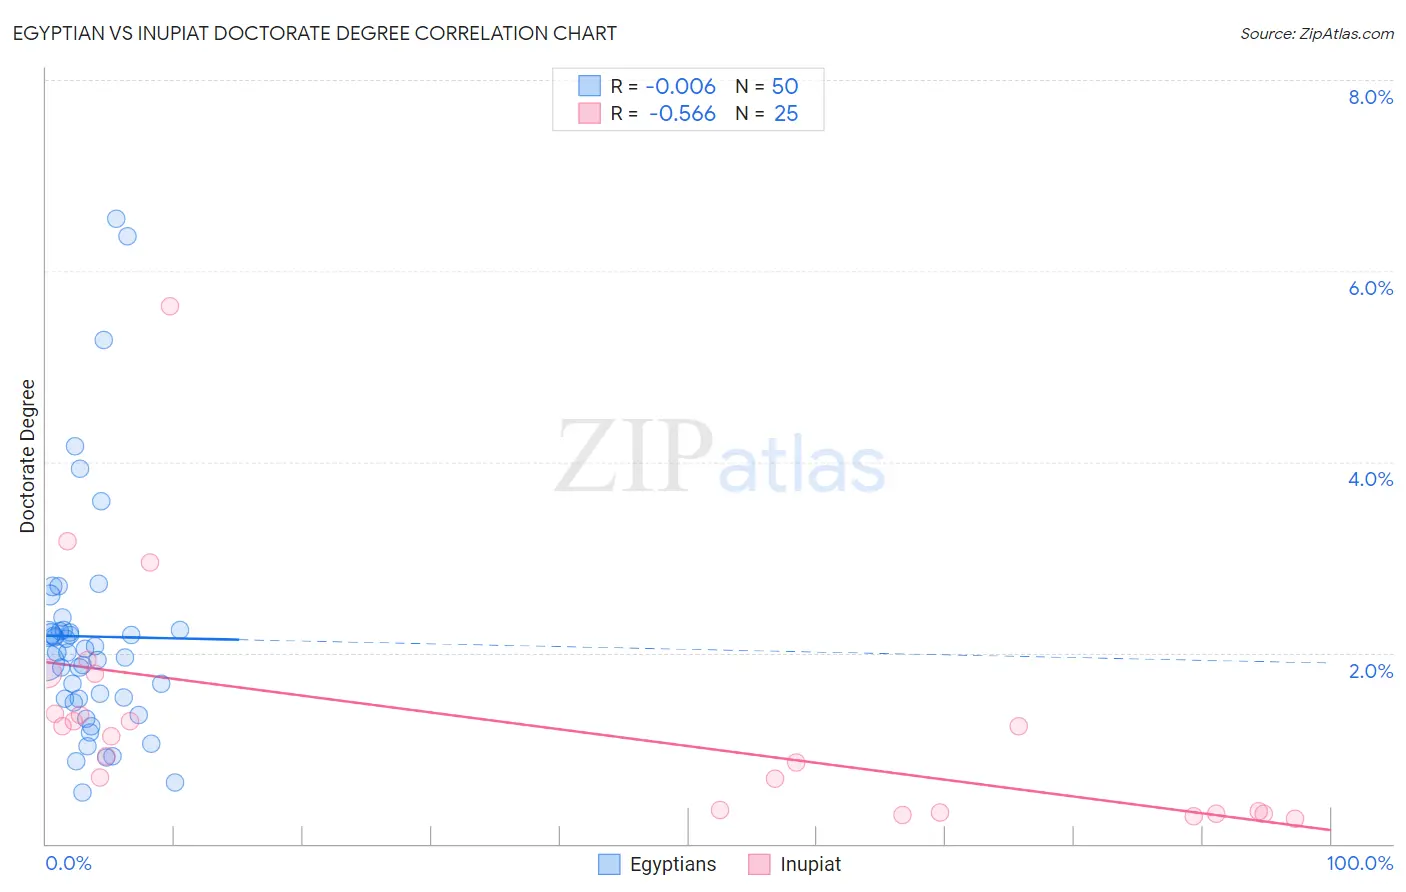
Egyptian vs Inupiat Doctorate Degree Correlation Chart

The statistical analysis conducted on geographies consisting of 275,731,799 people shows no correlation between the proportion of Egyptians and percentage of population with at least doctorate degree education in the United States with a correlation coefficient (R) of -0.006 and weighted average of 2.2%. Similarly, the statistical analysis conducted on geographies consisting of 95,805,354 people shows a substantial negative correlation between the proportion of Inupiat and percentage of population with at least doctorate degree education in the United States with a correlation coefficient (R) of -0.566 and weighted average of 1.3%, a difference of 67.4%.
Egyptian vs Inupiat Doctorate Degree

Doctorate Degree Correlation Summary

MeasurementEgyptianInupiat
Minimum0.53%0.27%
Maximum6.5%5.6%
Range6.0%5.4%
Mean2.2%1.3%
Median2.0%1.1%
Interquartile 25% (IQ1)1.5%0.33%
Interquartile 75% (IQ3)2.2%1.6%
Interquartile Range (IQR)0.72%1.2%
Standard Deviation (Sample)1.2%1.2%
Standard Deviation (Population)1.2%1.2%

Similar Demographics by Doctorate Degree

Demographics Similar to Egyptians by Doctorate Degree

In terms of doctorate degree, the demographic groups most similar to Egyptians are Immigrants from Zimbabwe (2.2%, a difference of 0.11%), Immigrants from Nepal (2.2%, a difference of 0.47%), Immigrants from Brazil (2.2%, a difference of 0.70%), Immigrants from England (2.2%, a difference of 0.83%), and British (2.2%, a difference of 0.91%).
DemographicsRating | RankDoctorate Degree
Northern Europeans
99.7
/100
|
#79
Exceptional
2.2%
Ugandans
99.7
/100
|
#80
Exceptional
2.2%
Immigrants | Argentina
99.7
/100
|
#81
Exceptional
2.2%
Immigrants | Uganda
99.6
/100
|
#82
Exceptional
2.2%
Immigrants | Lithuania
99.6
/100
|
#83
Exceptional
2.2%
Immigrants | England
99.6
/100
|
#84
Exceptional
2.2%
Immigrants | Brazil
99.6
/100
|
#85
Exceptional
2.2%
Egyptians
99.4
/100
|
#86
Exceptional
2.2%
Immigrants | Zimbabwe
99.4
/100
|
#87
Exceptional
2.2%
Immigrants | Nepal
99.3
/100
|
#88
Exceptional
2.2%
British
99.3
/100
|
#89
Exceptional
2.2%
Immigrants | Scotland
99.2
/100
|
#90
Exceptional
2.2%
Immigrants | Sudan
99.1
/100
|
#91
Exceptional
2.2%
Chileans
99.1
/100
|
#92
Exceptional
2.2%
Alsatians
99.0
/100
|
#93
Exceptional
2.1%

Demographics Similar to Inupiat by Doctorate Degree

In terms of doctorate degree, the demographic groups most similar to Inupiat are Haitian (1.3%, a difference of 0.050%), Yup'ik (1.3%, a difference of 0.27%), Immigrants from Latin America (1.3%, a difference of 0.28%), Hispanic or Latino (1.3%, a difference of 0.58%), and Immigrants from Cabo Verde (1.3%, a difference of 0.87%).
DemographicsRating | RankDoctorate Degree
Dutch West Indians
0.1
/100
|
#321
Tragic
1.3%
Seminole
0.1
/100
|
#322
Tragic
1.3%
Immigrants | Belize
0.1
/100
|
#323
Tragic
1.3%
Natives/Alaskans
0.0
/100
|
#324
Tragic
1.3%
Pima
0.0
/100
|
#325
Tragic
1.3%
Immigrants | Cabo Verde
0.0
/100
|
#326
Tragic
1.3%
Hispanics or Latinos
0.0
/100
|
#327
Tragic
1.3%
Inupiat
0.0
/100
|
#328
Tragic
1.3%
Haitians
0.0
/100
|
#329
Tragic
1.3%
Yup'ik
0.0
/100
|
#330
Tragic
1.3%
Immigrants | Latin America
0.0
/100
|
#331
Tragic
1.3%
Yakama
0.0
/100
|
#332
Tragic
1.3%
Immigrants | Caribbean
0.0
/100
|
#333
Tragic
1.3%
Immigrants | Dominican Republic
0.0
/100
|
#334
Tragic
1.3%
Immigrants | Haiti
0.0
/100
|
#335
Tragic
1.3%