Egyptian vs Argentinean Doctorate Degree
COMPARE
Egyptian
Argentinean
Doctorate Degree
Doctorate Degree Comparison
Egyptians
Argentineans
2.2%
DOCTORATE DEGREE
99.4/ 100
METRIC RATING
86th/ 347
METRIC RANK
2.3%
DOCTORATE DEGREE
99.9/ 100
METRIC RATING
66th/ 347
METRIC RANK
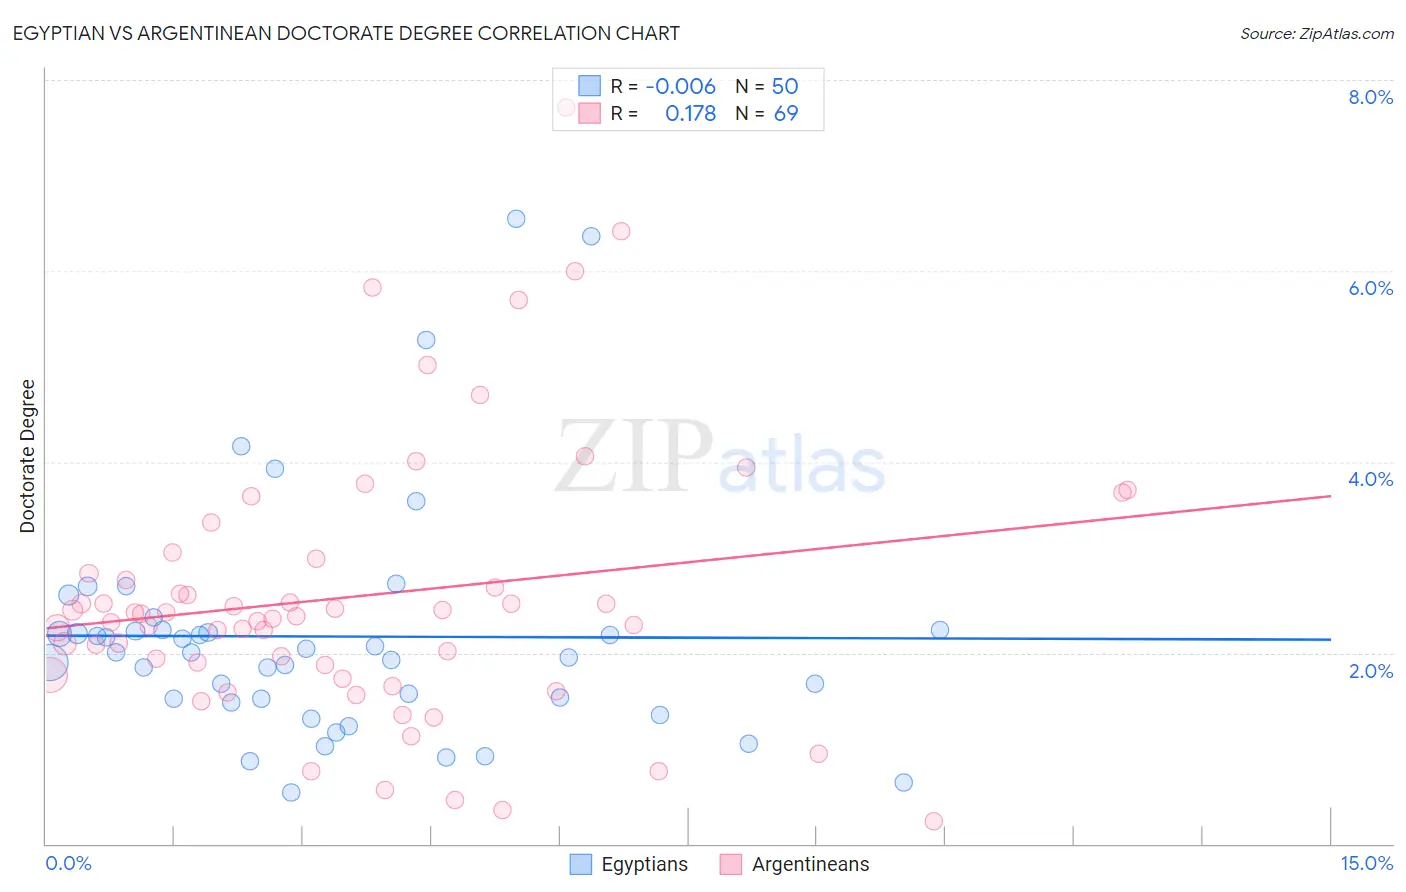
Egyptian vs Argentinean Doctorate Degree Correlation Chart
The statistical analysis conducted on geographies consisting of 275,731,799 people shows no correlation between the proportion of Egyptians and percentage of population with at least doctorate degree education in the United States with a correlation coefficient (R) of -0.006 and weighted average of 2.2%. Similarly, the statistical analysis conducted on geographies consisting of 296,190,369 people shows a poor positive correlation between the proportion of Argentineans and percentage of population with at least doctorate degree education in the United States with a correlation coefficient (R) of 0.178 and weighted average of 2.3%, a difference of 4.3%.
Doctorate Degree Correlation Summary
| Measurement | Egyptian | Argentinean |
| Minimum | 0.53% | 0.23% |
| Maximum | 6.5% | 7.7% |
| Range | 6.0% | 7.5% |
| Mean | 2.2% | 2.6% |
| Median | 2.0% | 2.4% |
| Interquartile 25% (IQ1) | 1.5% | 1.8% |
| Interquartile 75% (IQ3) | 2.2% | 2.9% |
| Interquartile Range (IQR) | 0.72% | 1.1% |
| Standard Deviation (Sample) | 1.2% | 1.4% |
| Standard Deviation (Population) | 1.2% | 1.4% |
Demographics Similar to Egyptians and Argentineans by Doctorate Degree
In terms of doctorate degree, the demographic groups most similar to Egyptians are Immigrants from Brazil (2.2%, a difference of 0.70%), Immigrants from England (2.2%, a difference of 0.83%), Immigrants from Lithuania (2.2%, a difference of 0.98%), Immigrants from Uganda (2.2%, a difference of 1.1%), and Immigrants from Argentina (2.2%, a difference of 1.7%). Similarly, the demographic groups most similar to Argentineans are Zimbabwean (2.3%, a difference of 0.46%), Immigrants from Kazakhstan (2.3%, a difference of 0.69%), Carpatho Rusyn (2.3%, a difference of 0.94%), Lithuanian (2.3%, a difference of 1.1%), and Immigrants from Bolivia (2.3%, a difference of 1.1%).
| Demographics | Rating | Rank | Doctorate Degree |
| Argentineans | 99.9 /100 | #66 | Exceptional 2.3% |
| Zimbabweans | 99.8 /100 | #67 | Exceptional 2.3% |
| Immigrants | Kazakhstan | 99.8 /100 | #68 | Exceptional 2.3% |
| Carpatho Rusyns | 99.8 /100 | #69 | Exceptional 2.3% |
| Lithuanians | 99.8 /100 | #70 | Exceptional 2.3% |
| Immigrants | Bolivia | 99.8 /100 | #71 | Exceptional 2.3% |
| Immigrants | Canada | 99.8 /100 | #72 | Exceptional 2.3% |
| Immigrants | Bulgaria | 99.8 /100 | #73 | Exceptional 2.3% |
| Immigrants | North America | 99.8 /100 | #74 | Exceptional 2.2% |
| Immigrants | Western Asia | 99.8 /100 | #75 | Exceptional 2.2% |
| Immigrants | Hungary | 99.8 /100 | #76 | Exceptional 2.2% |
| Immigrants | Lebanon | 99.8 /100 | #77 | Exceptional 2.2% |
| Immigrants | Belarus | 99.7 /100 | #78 | Exceptional 2.2% |
| Northern Europeans | 99.7 /100 | #79 | Exceptional 2.2% |
| Ugandans | 99.7 /100 | #80 | Exceptional 2.2% |
| Immigrants | Argentina | 99.7 /100 | #81 | Exceptional 2.2% |
| Immigrants | Uganda | 99.6 /100 | #82 | Exceptional 2.2% |
| Immigrants | Lithuania | 99.6 /100 | #83 | Exceptional 2.2% |
| Immigrants | England | 99.6 /100 | #84 | Exceptional 2.2% |
| Immigrants | Brazil | 99.6 /100 | #85 | Exceptional 2.2% |
| Egyptians | 99.4 /100 | #86 | Exceptional 2.2% |