Egyptian vs Immigrants from Spain 10th Grade
COMPARE
Egyptian
Immigrants from Spain
10th Grade
10th Grade Comparison
Egyptians
Immigrants from Spain
94.0%
10TH GRADE
79.6/ 100
METRIC RATING
150th/ 347
METRIC RANK
93.8%
10TH GRADE
55.9/ 100
METRIC RATING
169th/ 347
METRIC RANK
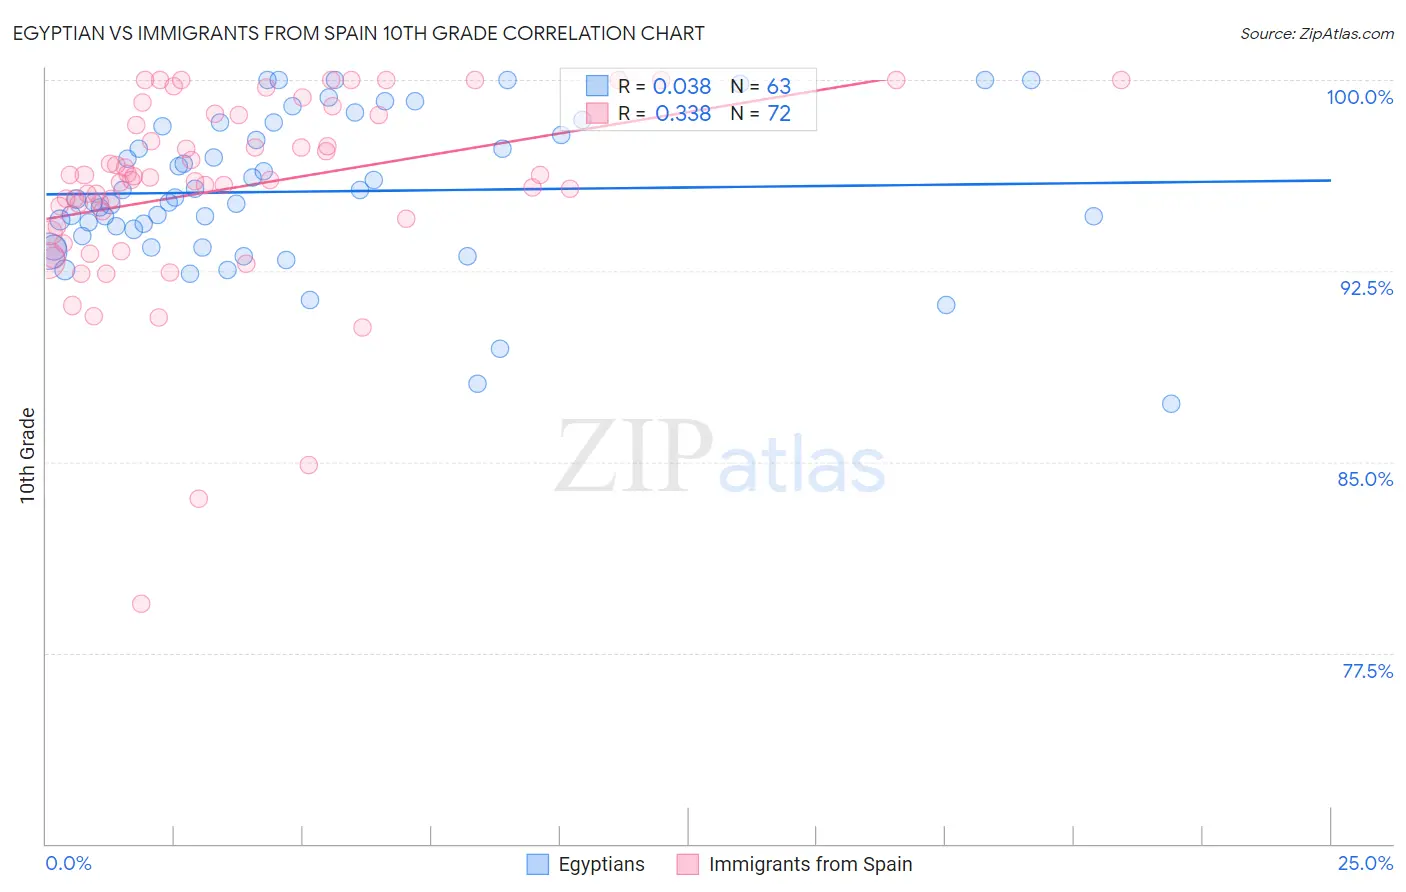
Egyptian vs Immigrants from Spain 10th Grade Correlation Chart
The statistical analysis conducted on geographies consisting of 276,927,519 people shows no correlation between the proportion of Egyptians and percentage of population with at least 10th grade education in the United States with a correlation coefficient (R) of 0.038 and weighted average of 94.0%. Similarly, the statistical analysis conducted on geographies consisting of 239,682,725 people shows a mild positive correlation between the proportion of Immigrants from Spain and percentage of population with at least 10th grade education in the United States with a correlation coefficient (R) of 0.338 and weighted average of 93.8%, a difference of 0.25%.
10th Grade Correlation Summary
| Measurement | Egyptian | Immigrants from Spain |
| Minimum | 87.3% | 79.4% |
| Maximum | 100.0% | 100.0% |
| Range | 12.7% | 20.6% |
| Mean | 95.6% | 95.7% |
| Median | 95.3% | 96.1% |
| Interquartile 25% (IQ1) | 93.9% | 94.4% |
| Interquartile 75% (IQ3) | 98.2% | 98.6% |
| Interquartile Range (IQR) | 4.3% | 4.2% |
| Standard Deviation (Sample) | 2.9% | 3.8% |
| Standard Deviation (Population) | 2.9% | 3.8% |
Demographics Similar to Egyptians and Immigrants from Spain by 10th Grade
In terms of 10th grade, the demographic groups most similar to Egyptians are Kenyan (94.0%, a difference of 0.010%), Ugandan (94.0%, a difference of 0.020%), Immigrants from Italy (94.0%, a difference of 0.020%), Immigrants from Brazil (94.0%, a difference of 0.050%), and Immigrants from Kenya (94.0%, a difference of 0.060%). Similarly, the demographic groups most similar to Immigrants from Spain are Alsatian (93.8%, a difference of 0.030%), Immigrants from Egypt (93.8%, a difference of 0.060%), Brazilian (93.8%, a difference of 0.070%), Immigrants from Iraq (93.8%, a difference of 0.070%), and Iraqi (93.9%, a difference of 0.12%).
| Demographics | Rating | Rank | 10th Grade |
| Ugandans | 80.7 /100 | #149 | Excellent 94.0% |
| Egyptians | 79.6 /100 | #150 | Good 94.0% |
| Kenyans | 79.1 /100 | #151 | Good 94.0% |
| Immigrants | Italy | 78.0 /100 | #152 | Good 94.0% |
| Immigrants | Brazil | 75.5 /100 | #153 | Good 94.0% |
| Immigrants | Kenya | 75.3 /100 | #154 | Good 94.0% |
| Spanish | 74.9 /100 | #155 | Good 94.0% |
| Mongolians | 74.4 /100 | #156 | Good 94.0% |
| Kiowa | 73.3 /100 | #157 | Good 93.9% |
| Bermudans | 71.0 /100 | #158 | Good 93.9% |
| Chileans | 70.2 /100 | #159 | Good 93.9% |
| Pakistanis | 70.1 /100 | #160 | Good 93.9% |
| Assyrians/Chaldeans/Syriacs | 69.7 /100 | #161 | Good 93.9% |
| Immigrants | Poland | 69.6 /100 | #162 | Good 93.9% |
| Venezuelans | 69.5 /100 | #163 | Good 93.9% |
| Iraqis | 68.1 /100 | #164 | Good 93.9% |
| Brazilians | 63.6 /100 | #165 | Good 93.8% |
| Immigrants | Iraq | 63.0 /100 | #166 | Good 93.8% |
| Immigrants | Egypt | 62.3 /100 | #167 | Good 93.8% |
| Alsatians | 59.4 /100 | #168 | Average 93.8% |
| Immigrants | Spain | 55.9 /100 | #169 | Average 93.8% |