Ecuadorian vs Subsaharan African 1st Grade
COMPARE
Ecuadorian
Subsaharan African
1st Grade
1st Grade Comparison
Ecuadorians
Sub-Saharan Africans
97.0%
1ST GRADE
0.0/ 100
METRIC RATING
305th/ 347
METRIC RANK
97.7%
1ST GRADE
3.6/ 100
METRIC RATING
228th/ 347
METRIC RANK
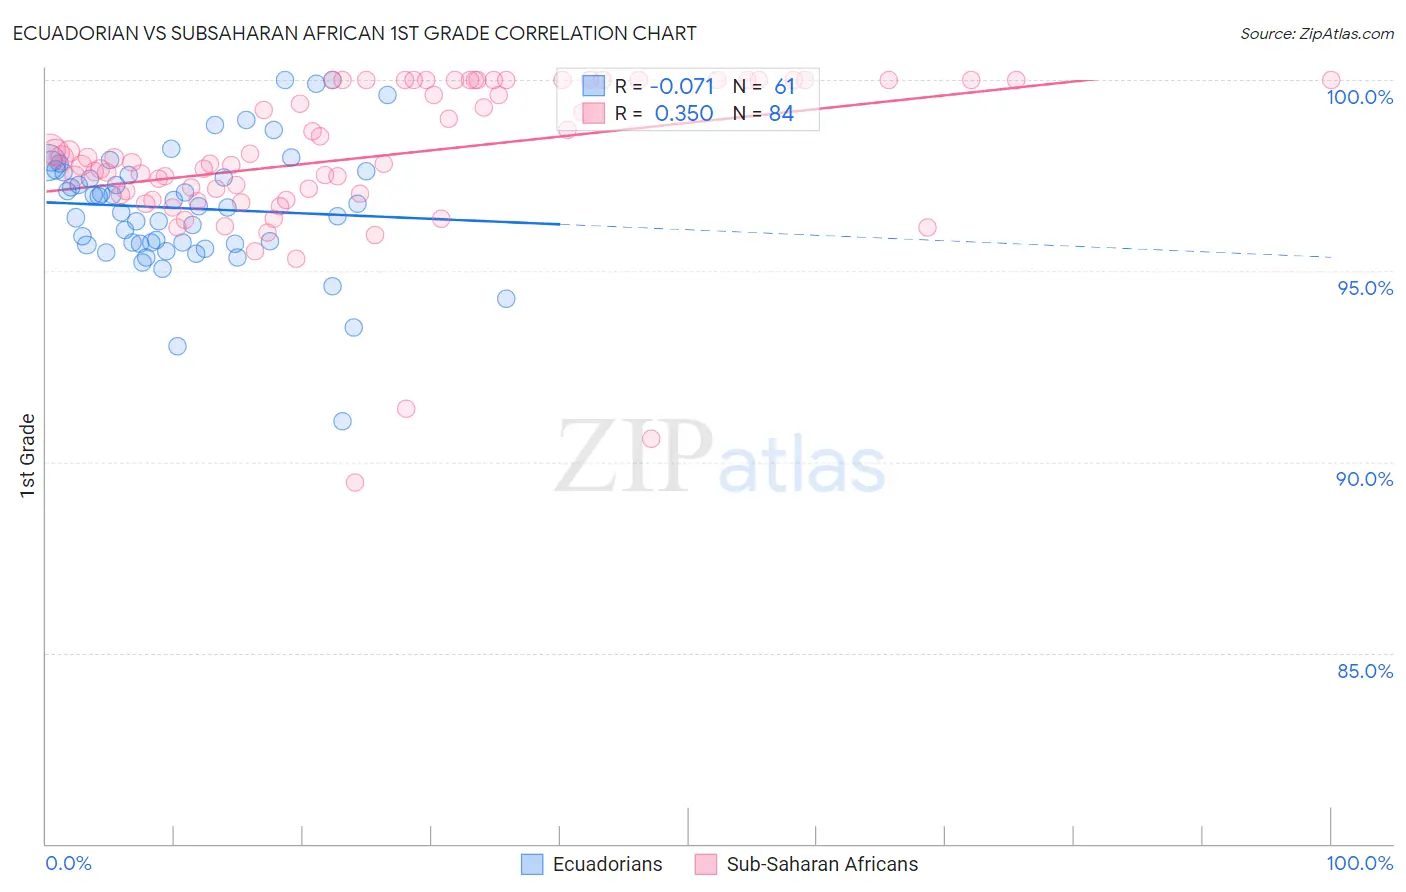
Ecuadorian vs Subsaharan African 1st Grade Correlation Chart
The statistical analysis conducted on geographies consisting of 317,865,723 people shows a slight negative correlation between the proportion of Ecuadorians and percentage of population with at least 1st grade education in the United States with a correlation coefficient (R) of -0.071 and weighted average of 97.0%. Similarly, the statistical analysis conducted on geographies consisting of 508,209,936 people shows a mild positive correlation between the proportion of Sub-Saharan Africans and percentage of population with at least 1st grade education in the United States with a correlation coefficient (R) of 0.350 and weighted average of 97.7%, a difference of 0.70%.
1st Grade Correlation Summary
| Measurement | Ecuadorian | Subsaharan African |
| Minimum | 91.1% | 89.5% |
| Maximum | 100.0% | 100.0% |
| Range | 8.9% | 10.5% |
| Mean | 96.6% | 98.0% |
| Median | 96.7% | 97.9% |
| Interquartile 25% (IQ1) | 95.7% | 97.0% |
| Interquartile 75% (IQ3) | 97.6% | 100.0% |
| Interquartile Range (IQR) | 1.9% | 3.0% |
| Standard Deviation (Sample) | 1.6% | 2.0% |
| Standard Deviation (Population) | 1.6% | 2.0% |
Similar Demographics by 1st Grade
Demographics Similar to Ecuadorians by 1st Grade
In terms of 1st grade, the demographic groups most similar to Ecuadorians are Nicaraguan (97.0%, a difference of 0.0%), Somali (97.0%, a difference of 0.020%), Immigrants from Caribbean (97.0%, a difference of 0.050%), Belizean (96.9%, a difference of 0.060%), and Immigrants from Somalia (96.9%, a difference of 0.060%).
| Demographics | Rating | Rank | 1st Grade |
| Immigrants | Dominica | 0.0 /100 | #298 | Tragic 97.1% |
| Immigrants | Cuba | 0.0 /100 | #299 | Tragic 97.1% |
| Haitians | 0.0 /100 | #300 | Tragic 97.1% |
| Immigrants | South Eastern Asia | 0.0 /100 | #301 | Tragic 97.1% |
| Immigrants | Caribbean | 0.0 /100 | #302 | Tragic 97.0% |
| Somalis | 0.0 /100 | #303 | Tragic 97.0% |
| Nicaraguans | 0.0 /100 | #304 | Tragic 97.0% |
| Ecuadorians | 0.0 /100 | #305 | Tragic 97.0% |
| Belizeans | 0.0 /100 | #306 | Tragic 96.9% |
| Immigrants | Somalia | 0.0 /100 | #307 | Tragic 96.9% |
| Hispanics or Latinos | 0.0 /100 | #308 | Tragic 96.9% |
| Immigrants | Haiti | 0.0 /100 | #309 | Tragic 96.9% |
| Immigrants | Azores | 0.0 /100 | #310 | Tragic 96.9% |
| Sri Lankans | 0.0 /100 | #311 | Tragic 96.9% |
| Cape Verdeans | 0.0 /100 | #312 | Tragic 96.9% |
Demographics Similar to Sub-Saharan Africans by 1st Grade
In terms of 1st grade, the demographic groups most similar to Sub-Saharan Africans are Sudanese (97.7%, a difference of 0.0%), Sierra Leonean (97.7%, a difference of 0.0%), Immigrants from Costa Rica (97.7%, a difference of 0.0%), Senegalese (97.7%, a difference of 0.0%), and Immigrants from Sudan (97.7%, a difference of 0.010%).
| Demographics | Rating | Rank | 1st Grade |
| Immigrants | Sudan | 4.3 /100 | #221 | Tragic 97.7% |
| Immigrants | Syria | 4.2 /100 | #222 | Tragic 97.7% |
| Immigrants | Zaire | 4.1 /100 | #223 | Tragic 97.7% |
| Iraqis | 4.0 /100 | #224 | Tragic 97.7% |
| Immigrants | Nepal | 4.0 /100 | #225 | Tragic 97.7% |
| Sudanese | 3.7 /100 | #226 | Tragic 97.7% |
| Sierra Leoneans | 3.6 /100 | #227 | Tragic 97.7% |
| Sub-Saharan Africans | 3.6 /100 | #228 | Tragic 97.7% |
| Immigrants | Costa Rica | 3.5 /100 | #229 | Tragic 97.7% |
| Senegalese | 3.5 /100 | #230 | Tragic 97.7% |
| Puerto Ricans | 3.0 /100 | #231 | Tragic 97.7% |
| Immigrants | Uruguay | 2.5 /100 | #232 | Tragic 97.6% |
| Immigrants | Pakistan | 2.2 /100 | #233 | Tragic 97.6% |
| Colombians | 2.2 /100 | #234 | Tragic 97.6% |
| Immigrants | Malaysia | 2.1 /100 | #235 | Tragic 97.6% |