Immigrants from Greece vs Pennsylvania German Bachelor's Degree
COMPARE
Immigrants from Greece
Pennsylvania German
Bachelor's Degree
Bachelor's Degree Comparison
Immigrants from Greece
Pennsylvania Germans
44.5%
BACHELOR'S DEGREE
99.9/ 100
METRIC RATING
50th/ 347
METRIC RANK
28.4%
BACHELOR'S DEGREE
0.0/ 100
METRIC RATING
325th/ 347
METRIC RANK
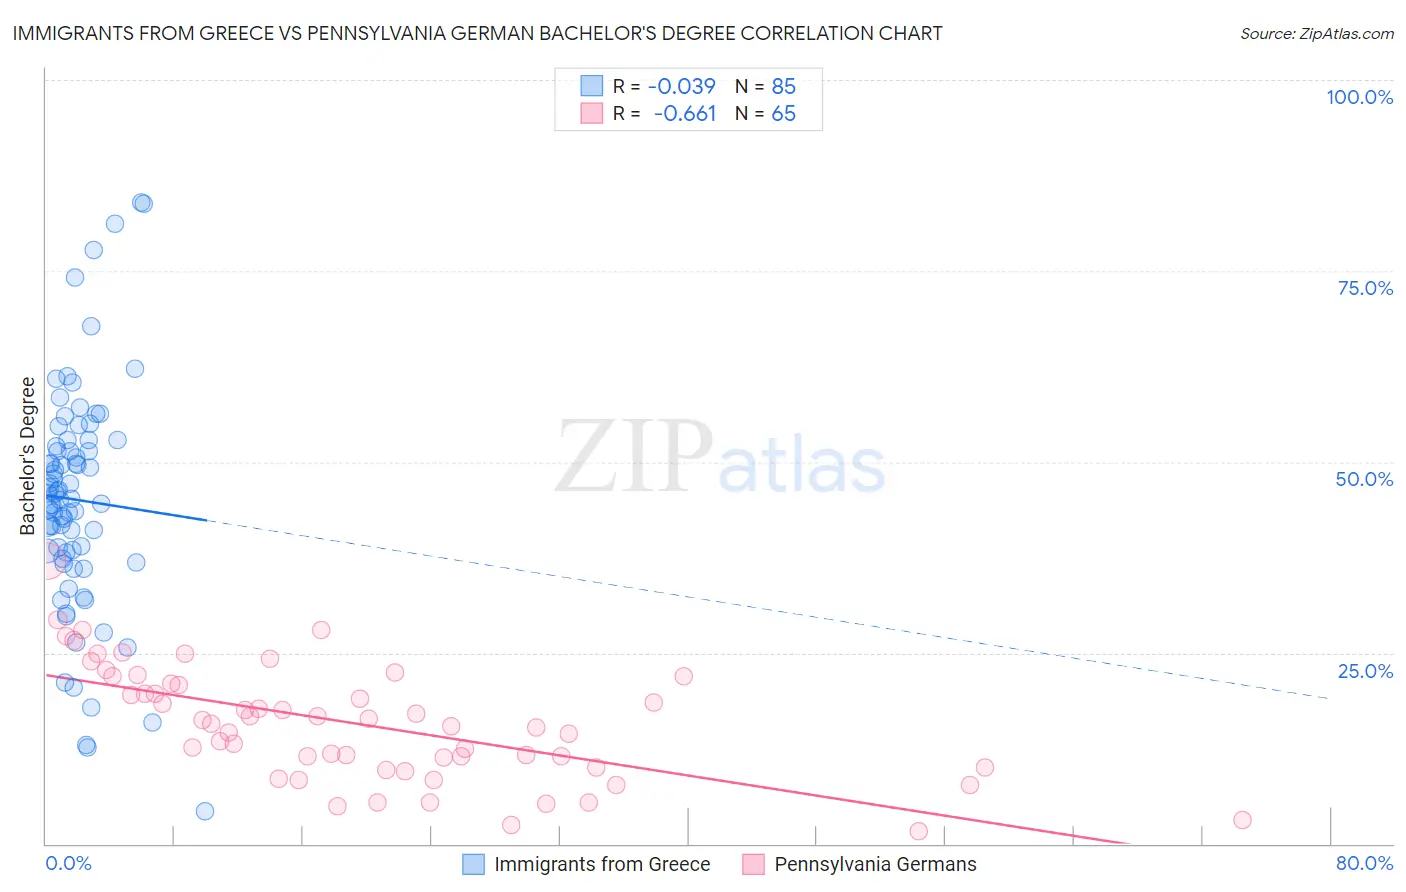
Immigrants from Greece vs Pennsylvania German Bachelor's Degree Correlation Chart
The statistical analysis conducted on geographies consisting of 216,876,242 people shows no correlation between the proportion of Immigrants from Greece and percentage of population with at least bachelor's degree education in the United States with a correlation coefficient (R) of -0.039 and weighted average of 44.5%. Similarly, the statistical analysis conducted on geographies consisting of 234,090,370 people shows a significant negative correlation between the proportion of Pennsylvania Germans and percentage of population with at least bachelor's degree education in the United States with a correlation coefficient (R) of -0.661 and weighted average of 28.4%, a difference of 56.6%.
Bachelor's Degree Correlation Summary
| Measurement | Immigrants from Greece | Pennsylvania German |
| Minimum | 4.3% | 1.6% |
| Maximum | 83.9% | 37.0% |
| Range | 79.6% | 35.5% |
| Mean | 45.0% | 15.7% |
| Median | 45.2% | 15.7% |
| Interquartile 25% (IQ1) | 37.8% | 10.0% |
| Interquartile 75% (IQ3) | 52.4% | 21.4% |
| Interquartile Range (IQR) | 14.6% | 11.4% |
| Standard Deviation (Sample) | 14.9% | 7.5% |
| Standard Deviation (Population) | 14.8% | 7.4% |
Similar Demographics by Bachelor's Degree
Demographics Similar to Immigrants from Greece by Bachelor's Degree
In terms of bachelor's degree, the demographic groups most similar to Immigrants from Greece are Immigrants from Norway (44.5%, a difference of 0.12%), Asian (44.4%, a difference of 0.14%), Bolivian (44.6%, a difference of 0.24%), Estonian (44.6%, a difference of 0.24%), and Immigrants from Bulgaria (44.6%, a difference of 0.28%).
| Demographics | Rating | Rank | Bachelor's Degree |
| Immigrants | South Africa | 99.9 /100 | #43 | Exceptional 44.8% |
| Immigrants | Lithuania | 99.9 /100 | #44 | Exceptional 44.6% |
| Immigrants | Kuwait | 99.9 /100 | #45 | Exceptional 44.6% |
| Immigrants | Bulgaria | 99.9 /100 | #46 | Exceptional 44.6% |
| Bolivians | 99.9 /100 | #47 | Exceptional 44.6% |
| Estonians | 99.9 /100 | #48 | Exceptional 44.6% |
| Immigrants | Norway | 99.9 /100 | #49 | Exceptional 44.5% |
| Immigrants | Greece | 99.9 /100 | #50 | Exceptional 44.5% |
| Asians | 99.9 /100 | #51 | Exceptional 44.4% |
| Immigrants | Spain | 99.9 /100 | #52 | Exceptional 44.3% |
| Immigrants | Asia | 99.9 /100 | #53 | Exceptional 44.3% |
| Immigrants | Austria | 99.9 /100 | #54 | Exceptional 44.2% |
| Immigrants | Bolivia | 99.9 /100 | #55 | Exceptional 44.2% |
| Immigrants | Serbia | 99.9 /100 | #56 | Exceptional 44.1% |
| Paraguayans | 99.9 /100 | #57 | Exceptional 44.0% |
Demographics Similar to Pennsylvania Germans by Bachelor's Degree
In terms of bachelor's degree, the demographic groups most similar to Pennsylvania Germans are Apache (28.3%, a difference of 0.39%), Dutch West Indian (28.5%, a difference of 0.45%), Paiute (28.1%, a difference of 1.1%), Fijian (28.7%, a difference of 1.2%), and Tsimshian (28.8%, a difference of 1.3%).
| Demographics | Rating | Rank | Bachelor's Degree |
| Yaqui | 0.0 /100 | #318 | Tragic 29.0% |
| Creek | 0.0 /100 | #319 | Tragic 28.9% |
| Kiowa | 0.0 /100 | #320 | Tragic 28.8% |
| Alaskan Athabascans | 0.0 /100 | #321 | Tragic 28.8% |
| Tsimshian | 0.0 /100 | #322 | Tragic 28.8% |
| Fijians | 0.0 /100 | #323 | Tragic 28.7% |
| Dutch West Indians | 0.0 /100 | #324 | Tragic 28.5% |
| Pennsylvania Germans | 0.0 /100 | #325 | Tragic 28.4% |
| Apache | 0.0 /100 | #326 | Tragic 28.3% |
| Paiute | 0.0 /100 | #327 | Tragic 28.1% |
| Crow | 0.0 /100 | #328 | Tragic 27.7% |
| Immigrants | Central America | 0.0 /100 | #329 | Tragic 27.5% |
| Spanish American Indians | 0.0 /100 | #330 | Tragic 27.5% |
| Immigrants | Azores | 0.0 /100 | #331 | Tragic 27.3% |
| Menominee | 0.0 /100 | #332 | Tragic 27.3% |