Immigrants from Congo vs Navajo 8th Grade
COMPARE
Immigrants from Congo
Navajo
8th Grade
8th Grade Comparison
Immigrants from Congo
Navajo
94.9%
8TH GRADE
0.6/ 100
METRIC RATING
258th/ 347
METRIC RANK
95.3%
8TH GRADE
5.7/ 100
METRIC RATING
226th/ 347
METRIC RANK
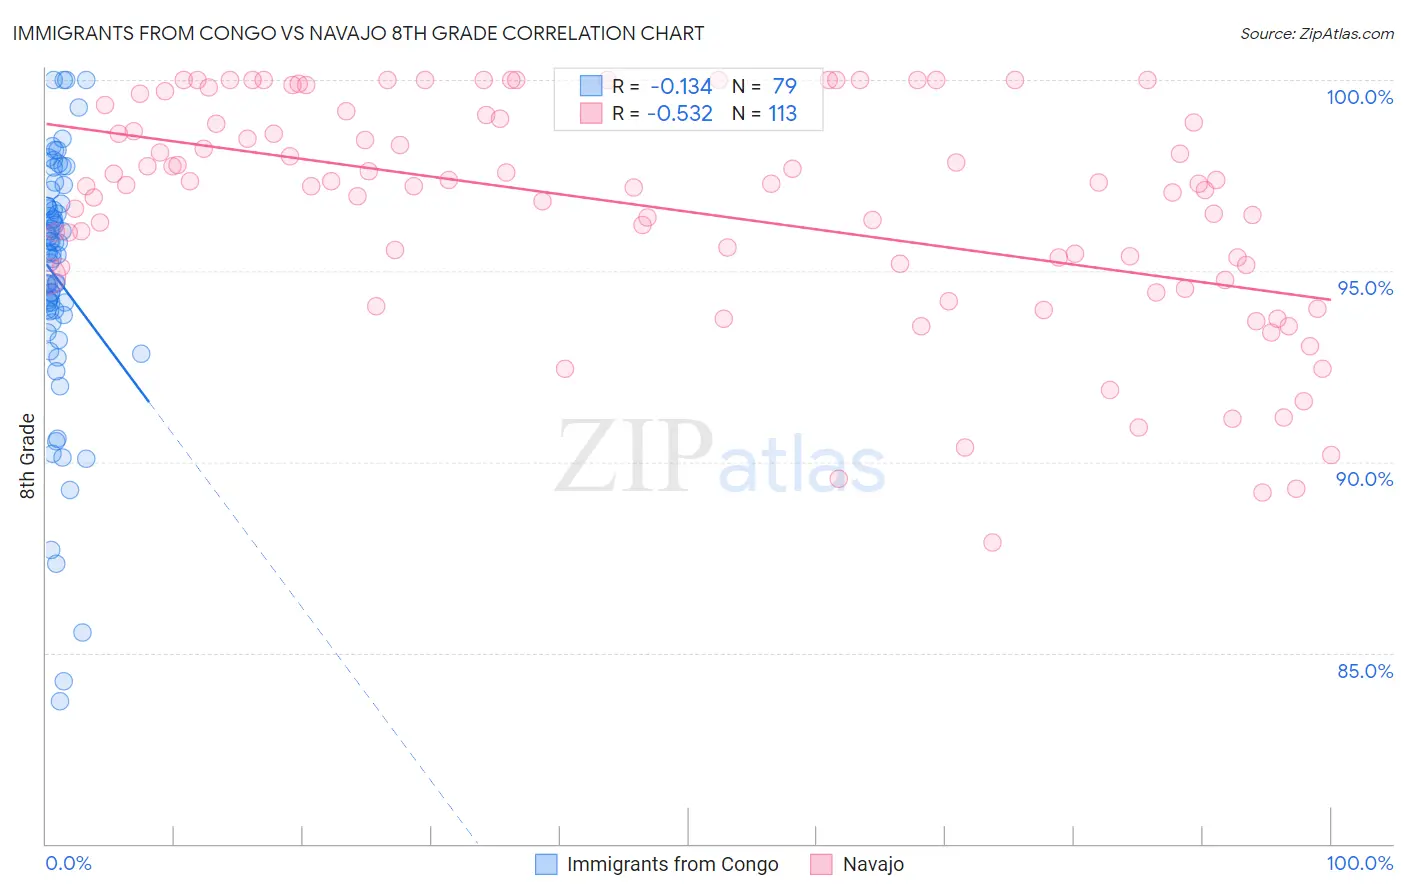
Immigrants from Congo vs Navajo 8th Grade Correlation Chart
The statistical analysis conducted on geographies consisting of 92,121,907 people shows a poor negative correlation between the proportion of Immigrants from Congo and percentage of population with at least 8th grade education in the United States with a correlation coefficient (R) of -0.134 and weighted average of 94.9%. Similarly, the statistical analysis conducted on geographies consisting of 224,871,905 people shows a substantial negative correlation between the proportion of Navajo and percentage of population with at least 8th grade education in the United States with a correlation coefficient (R) of -0.532 and weighted average of 95.3%, a difference of 0.38%.
8th Grade Correlation Summary
| Measurement | Immigrants from Congo | Navajo |
| Minimum | 83.7% | 87.9% |
| Maximum | 100.0% | 100.0% |
| Range | 16.3% | 12.1% |
| Mean | 94.8% | 96.6% |
| Median | 95.5% | 97.3% |
| Interquartile 25% (IQ1) | 93.8% | 95.0% |
| Interquartile 75% (IQ3) | 96.7% | 99.0% |
| Interquartile Range (IQR) | 2.9% | 4.0% |
| Standard Deviation (Sample) | 3.4% | 2.9% |
| Standard Deviation (Population) | 3.4% | 2.9% |
Similar Demographics by 8th Grade
Demographics Similar to Immigrants from Congo by 8th Grade
In terms of 8th grade, the demographic groups most similar to Immigrants from Congo are Ghanaian (94.9%, a difference of 0.0%), Afghan (94.9%, a difference of 0.010%), Immigrants from Jamaica (94.9%, a difference of 0.010%), Colombian (95.0%, a difference of 0.020%), and Immigrants from Somalia (95.0%, a difference of 0.030%).
| Demographics | Rating | Rank | 8th Grade |
| Bolivians | 1.0 /100 | #251 | Tragic 95.0% |
| Immigrants | Ethiopia | 1.0 /100 | #252 | Tragic 95.0% |
| U.S. Virgin Islanders | 0.9 /100 | #253 | Tragic 95.0% |
| Immigrants | Cameroon | 0.8 /100 | #254 | Tragic 95.0% |
| Immigrants | Somalia | 0.7 /100 | #255 | Tragic 95.0% |
| Colombians | 0.7 /100 | #256 | Tragic 95.0% |
| Afghans | 0.6 /100 | #257 | Tragic 94.9% |
| Immigrants | Congo | 0.6 /100 | #258 | Tragic 94.9% |
| Ghanaians | 0.6 /100 | #259 | Tragic 94.9% |
| Immigrants | Jamaica | 0.6 /100 | #260 | Tragic 94.9% |
| Immigrants | Costa Rica | 0.5 /100 | #261 | Tragic 94.9% |
| Immigrants | Nigeria | 0.4 /100 | #262 | Tragic 94.9% |
| Immigrants | Hong Kong | 0.4 /100 | #263 | Tragic 94.9% |
| South Americans | 0.4 /100 | #264 | Tragic 94.9% |
| Yuman | 0.4 /100 | #265 | Tragic 94.9% |
Demographics Similar to Navajo by 8th Grade
In terms of 8th grade, the demographic groups most similar to Navajo are Bahamian (95.3%, a difference of 0.0%), Immigrants from Western Asia (95.3%, a difference of 0.010%), Subsaharan African (95.3%, a difference of 0.010%), Immigrants from Eastern Africa (95.3%, a difference of 0.010%), and Immigrants from Malaysia (95.3%, a difference of 0.040%).
| Demographics | Rating | Rank | 8th Grade |
| Spanish Americans | 8.0 /100 | #219 | Tragic 95.4% |
| Immigrants | Southern Europe | 7.7 /100 | #220 | Tragic 95.3% |
| Immigrants | Syria | 7.4 /100 | #221 | Tragic 95.3% |
| Immigrants | Malaysia | 7.3 /100 | #222 | Tragic 95.3% |
| Immigrants | Oceania | 7.1 /100 | #223 | Tragic 95.3% |
| Immigrants | Western Asia | 6.0 /100 | #224 | Tragic 95.3% |
| Sub-Saharan Africans | 6.0 /100 | #225 | Tragic 95.3% |
| Navajo | 5.7 /100 | #226 | Tragic 95.3% |
| Bahamians | 5.6 /100 | #227 | Tragic 95.3% |
| Immigrants | Eastern Africa | 5.6 /100 | #228 | Tragic 95.3% |
| Immigrants | Indonesia | 4.4 /100 | #229 | Tragic 95.3% |
| Immigrants | Panama | 4.1 /100 | #230 | Tragic 95.2% |
| Asians | 3.5 /100 | #231 | Tragic 95.2% |
| Indians (Asian) | 3.3 /100 | #232 | Tragic 95.2% |
| Immigrants | Asia | 3.1 /100 | #233 | Tragic 95.2% |