Colombian vs Navajo 8th Grade
COMPARE
Colombian
Navajo
8th Grade
8th Grade Comparison
Colombians
Navajo
95.0%
8TH GRADE
0.7/ 100
METRIC RATING
256th/ 347
METRIC RANK
95.3%
8TH GRADE
5.7/ 100
METRIC RATING
226th/ 347
METRIC RANK
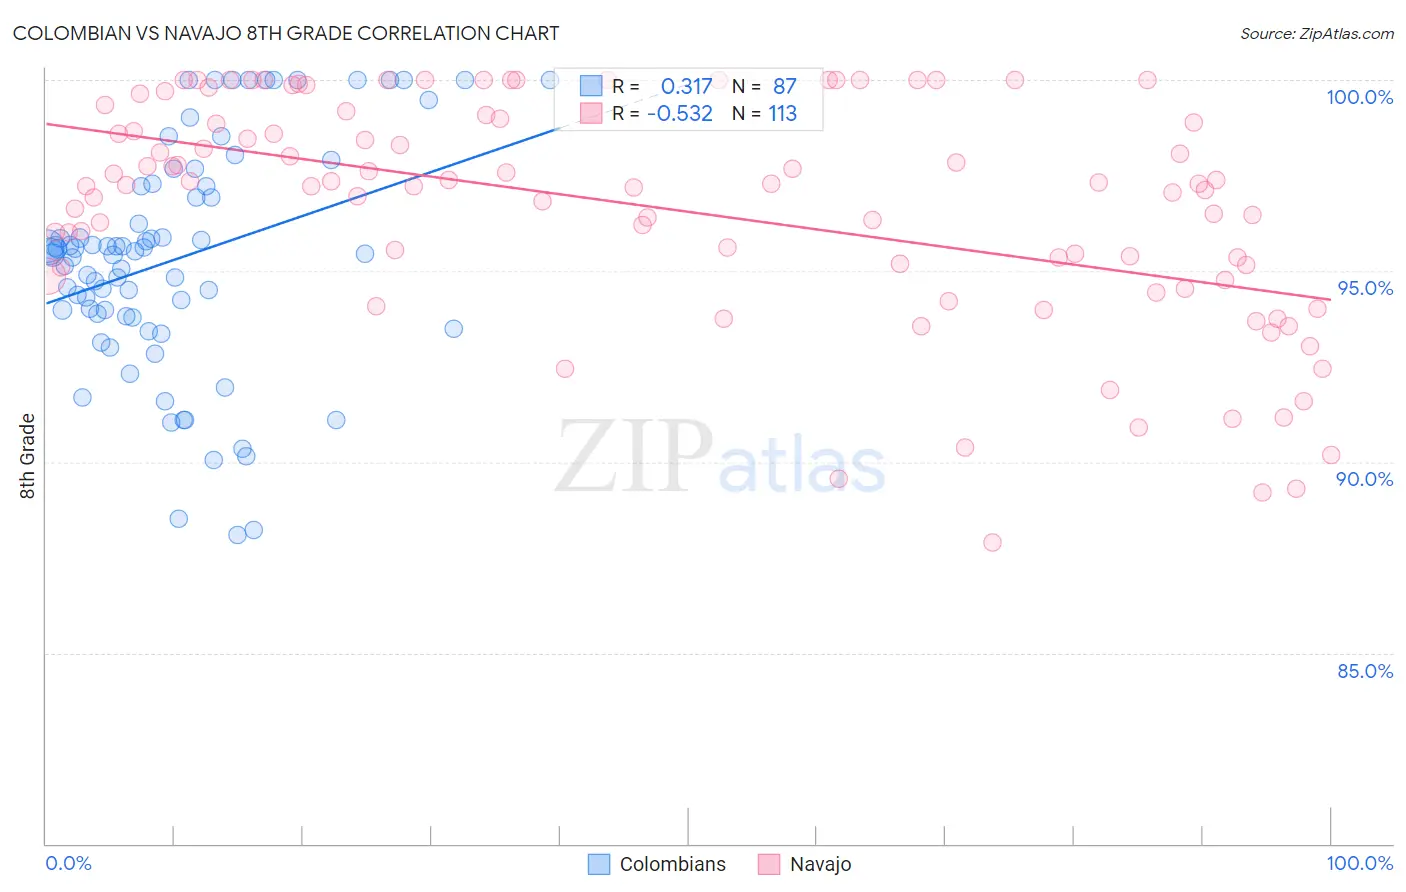
Colombian vs Navajo 8th Grade Correlation Chart
The statistical analysis conducted on geographies consisting of 419,655,116 people shows a mild positive correlation between the proportion of Colombians and percentage of population with at least 8th grade education in the United States with a correlation coefficient (R) of 0.317 and weighted average of 95.0%. Similarly, the statistical analysis conducted on geographies consisting of 224,871,905 people shows a substantial negative correlation between the proportion of Navajo and percentage of population with at least 8th grade education in the United States with a correlation coefficient (R) of -0.532 and weighted average of 95.3%, a difference of 0.36%.
8th Grade Correlation Summary
| Measurement | Colombian | Navajo |
| Minimum | 88.1% | 87.9% |
| Maximum | 100.0% | 100.0% |
| Range | 11.9% | 12.1% |
| Mean | 95.3% | 96.6% |
| Median | 95.5% | 97.3% |
| Interquartile 25% (IQ1) | 93.8% | 95.0% |
| Interquartile 75% (IQ3) | 97.2% | 99.0% |
| Interquartile Range (IQR) | 3.4% | 4.0% |
| Standard Deviation (Sample) | 3.0% | 2.9% |
| Standard Deviation (Population) | 2.9% | 2.9% |
Similar Demographics by 8th Grade
Demographics Similar to Colombians by 8th Grade
In terms of 8th grade, the demographic groups most similar to Colombians are Immigrants from Somalia (95.0%, a difference of 0.010%), Afghan (94.9%, a difference of 0.010%), Immigrants from Congo (94.9%, a difference of 0.020%), Ghanaian (94.9%, a difference of 0.020%), and Immigrants from Cameroon (95.0%, a difference of 0.030%).
| Demographics | Rating | Rank | 8th Grade |
| Immigrants | China | 1.1 /100 | #249 | Tragic 95.0% |
| Koreans | 1.1 /100 | #250 | Tragic 95.0% |
| Bolivians | 1.0 /100 | #251 | Tragic 95.0% |
| Immigrants | Ethiopia | 1.0 /100 | #252 | Tragic 95.0% |
| U.S. Virgin Islanders | 0.9 /100 | #253 | Tragic 95.0% |
| Immigrants | Cameroon | 0.8 /100 | #254 | Tragic 95.0% |
| Immigrants | Somalia | 0.7 /100 | #255 | Tragic 95.0% |
| Colombians | 0.7 /100 | #256 | Tragic 95.0% |
| Afghans | 0.6 /100 | #257 | Tragic 94.9% |
| Immigrants | Congo | 0.6 /100 | #258 | Tragic 94.9% |
| Ghanaians | 0.6 /100 | #259 | Tragic 94.9% |
| Immigrants | Jamaica | 0.6 /100 | #260 | Tragic 94.9% |
| Immigrants | Costa Rica | 0.5 /100 | #261 | Tragic 94.9% |
| Immigrants | Nigeria | 0.4 /100 | #262 | Tragic 94.9% |
| Immigrants | Hong Kong | 0.4 /100 | #263 | Tragic 94.9% |
Demographics Similar to Navajo by 8th Grade
In terms of 8th grade, the demographic groups most similar to Navajo are Bahamian (95.3%, a difference of 0.0%), Immigrants from Western Asia (95.3%, a difference of 0.010%), Subsaharan African (95.3%, a difference of 0.010%), Immigrants from Eastern Africa (95.3%, a difference of 0.010%), and Immigrants from Malaysia (95.3%, a difference of 0.040%).
| Demographics | Rating | Rank | 8th Grade |
| Spanish Americans | 8.0 /100 | #219 | Tragic 95.4% |
| Immigrants | Southern Europe | 7.7 /100 | #220 | Tragic 95.3% |
| Immigrants | Syria | 7.4 /100 | #221 | Tragic 95.3% |
| Immigrants | Malaysia | 7.3 /100 | #222 | Tragic 95.3% |
| Immigrants | Oceania | 7.1 /100 | #223 | Tragic 95.3% |
| Immigrants | Western Asia | 6.0 /100 | #224 | Tragic 95.3% |
| Sub-Saharan Africans | 6.0 /100 | #225 | Tragic 95.3% |
| Navajo | 5.7 /100 | #226 | Tragic 95.3% |
| Bahamians | 5.6 /100 | #227 | Tragic 95.3% |
| Immigrants | Eastern Africa | 5.6 /100 | #228 | Tragic 95.3% |
| Immigrants | Indonesia | 4.4 /100 | #229 | Tragic 95.3% |
| Immigrants | Panama | 4.1 /100 | #230 | Tragic 95.2% |
| Asians | 3.5 /100 | #231 | Tragic 95.2% |
| Indians (Asian) | 3.3 /100 | #232 | Tragic 95.2% |
| Immigrants | Asia | 3.1 /100 | #233 | Tragic 95.2% |