Immigrants from Sri Lanka vs Immigrants from Uruguay 8th Grade
COMPARE
Immigrants from Sri Lanka
Immigrants from Uruguay
8th Grade
8th Grade Comparison
Immigrants from Sri Lanka
Immigrants from Uruguay
95.8%
8TH GRADE
64.1/ 100
METRIC RATING
163rd/ 347
METRIC RANK
94.8%
8TH GRADE
0.3/ 100
METRIC RATING
268th/ 347
METRIC RANK
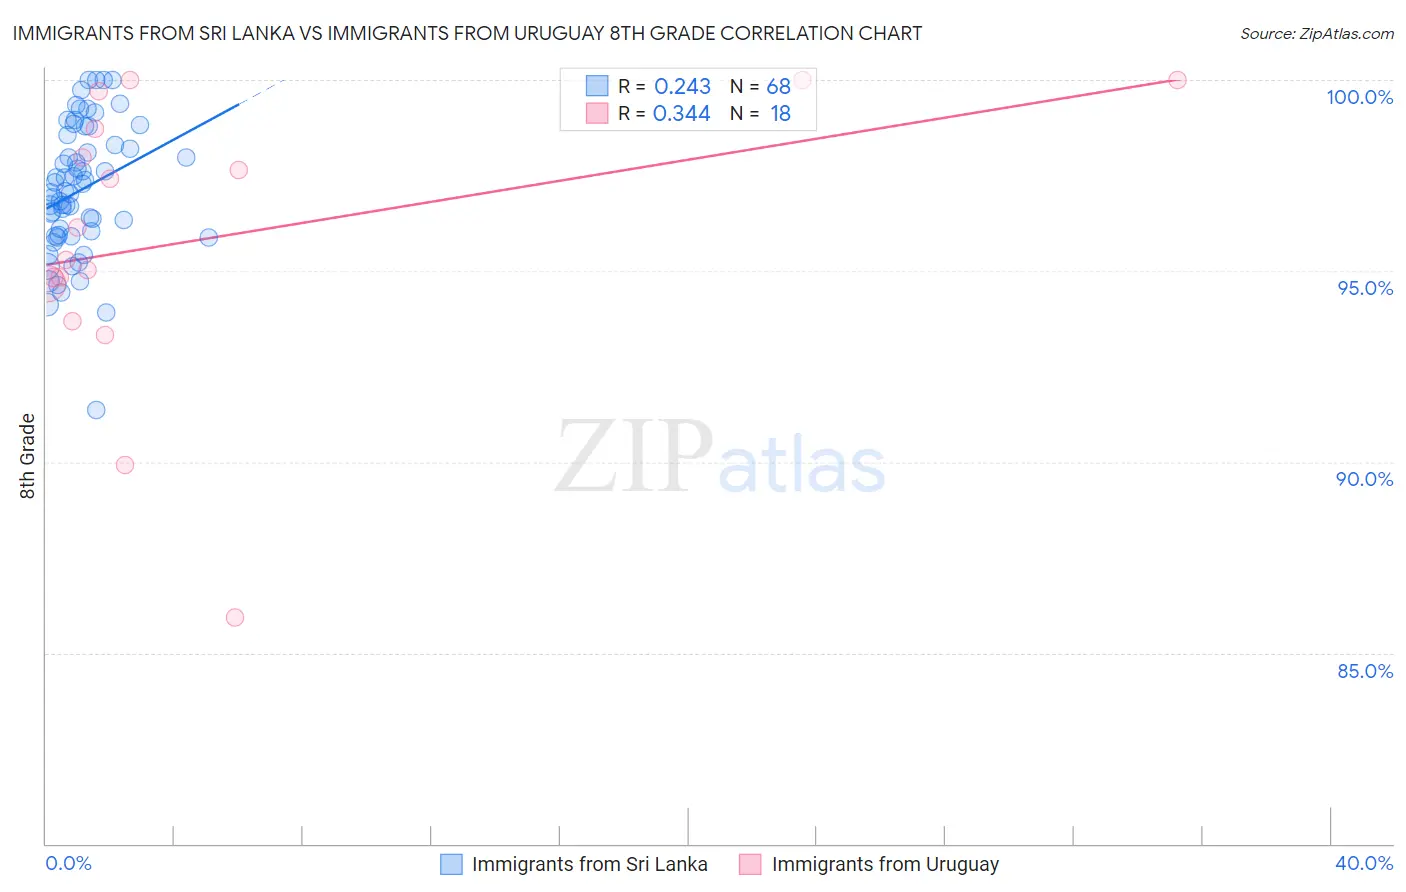
Immigrants from Sri Lanka vs Immigrants from Uruguay 8th Grade Correlation Chart
The statistical analysis conducted on geographies consisting of 149,660,761 people shows a weak positive correlation between the proportion of Immigrants from Sri Lanka and percentage of population with at least 8th grade education in the United States with a correlation coefficient (R) of 0.243 and weighted average of 95.8%. Similarly, the statistical analysis conducted on geographies consisting of 133,259,667 people shows a mild positive correlation between the proportion of Immigrants from Uruguay and percentage of population with at least 8th grade education in the United States with a correlation coefficient (R) of 0.344 and weighted average of 94.8%, a difference of 1.1%.
8th Grade Correlation Summary
| Measurement | Immigrants from Sri Lanka | Immigrants from Uruguay |
| Minimum | 91.4% | 85.9% |
| Maximum | 100.0% | 100.0% |
| Range | 8.6% | 14.1% |
| Mean | 97.1% | 95.8% |
| Median | 97.1% | 95.7% |
| Interquartile 25% (IQ1) | 95.9% | 94.7% |
| Interquartile 75% (IQ3) | 98.4% | 98.7% |
| Interquartile Range (IQR) | 2.5% | 4.1% |
| Standard Deviation (Sample) | 1.7% | 3.7% |
| Standard Deviation (Population) | 1.7% | 3.6% |
Similar Demographics by 8th Grade
Demographics Similar to Immigrants from Sri Lanka by 8th Grade
In terms of 8th grade, the demographic groups most similar to Immigrants from Sri Lanka are Immigrants from Italy (95.8%, a difference of 0.0%), Bermudan (95.8%, a difference of 0.020%), Immigrants from Kenya (95.8%, a difference of 0.020%), Alsatian (95.8%, a difference of 0.020%), and Immigrants from Poland (95.8%, a difference of 0.020%).
| Demographics | Rating | Rank | 8th Grade |
| Ugandans | 74.1 /100 | #156 | Good 95.9% |
| Immigrants | Taiwan | 70.5 /100 | #157 | Good 95.9% |
| Arabs | 69.4 /100 | #158 | Good 95.9% |
| Immigrants | Kazakhstan | 68.4 /100 | #159 | Good 95.9% |
| Seminole | 67.7 /100 | #160 | Good 95.8% |
| Bermudans | 67.5 /100 | #161 | Good 95.8% |
| Immigrants | Kenya | 67.2 /100 | #162 | Good 95.8% |
| Immigrants | Sri Lanka | 64.1 /100 | #163 | Good 95.8% |
| Immigrants | Italy | 63.5 /100 | #164 | Good 95.8% |
| Alsatians | 61.4 /100 | #165 | Good 95.8% |
| Immigrants | Poland | 61.1 /100 | #166 | Good 95.8% |
| Spaniards | 60.0 /100 | #167 | Good 95.8% |
| Immigrants | Ukraine | 59.5 /100 | #168 | Average 95.8% |
| Immigrants | Iran | 58.6 /100 | #169 | Average 95.8% |
| Ute | 58.5 /100 | #170 | Average 95.8% |
Demographics Similar to Immigrants from Uruguay by 8th Grade
In terms of 8th grade, the demographic groups most similar to Immigrants from Uruguay are Immigrants from Ghana (94.8%, a difference of 0.0%), West Indian (94.8%, a difference of 0.020%), Immigrants from Thailand (94.8%, a difference of 0.020%), Immigrants from Uzbekistan (94.8%, a difference of 0.040%), and Immigrants from Afghanistan (94.8%, a difference of 0.050%).
| Demographics | Rating | Rank | 8th Grade |
| Immigrants | Costa Rica | 0.5 /100 | #261 | Tragic 94.9% |
| Immigrants | Nigeria | 0.4 /100 | #262 | Tragic 94.9% |
| Immigrants | Hong Kong | 0.4 /100 | #263 | Tragic 94.9% |
| South Americans | 0.4 /100 | #264 | Tragic 94.9% |
| Yuman | 0.4 /100 | #265 | Tragic 94.9% |
| West Indians | 0.3 /100 | #266 | Tragic 94.8% |
| Immigrants | Ghana | 0.3 /100 | #267 | Tragic 94.8% |
| Immigrants | Uruguay | 0.3 /100 | #268 | Tragic 94.8% |
| Immigrants | Thailand | 0.2 /100 | #269 | Tragic 94.8% |
| Immigrants | Uzbekistan | 0.2 /100 | #270 | Tragic 94.8% |
| Immigrants | Afghanistan | 0.2 /100 | #271 | Tragic 94.8% |
| Immigrants | South America | 0.2 /100 | #272 | Tragic 94.8% |
| Immigrants | Western Africa | 0.2 /100 | #273 | Tragic 94.8% |
| Trinidadians and Tobagonians | 0.2 /100 | #274 | Tragic 94.7% |
| Immigrants | Colombia | 0.2 /100 | #275 | Tragic 94.7% |