Austrian vs Immigrants from North Macedonia Professional Degree
COMPARE
Austrian
Immigrants from North Macedonia
Professional Degree
Professional Degree Comparison
Austrians
Immigrants from North Macedonia
5.2%
PROFESSIONAL DEGREE
99.1/ 100
METRIC RATING
98th/ 347
METRIC RANK
4.2%
PROFESSIONAL DEGREE
20.2/ 100
METRIC RATING
200th/ 347
METRIC RANK
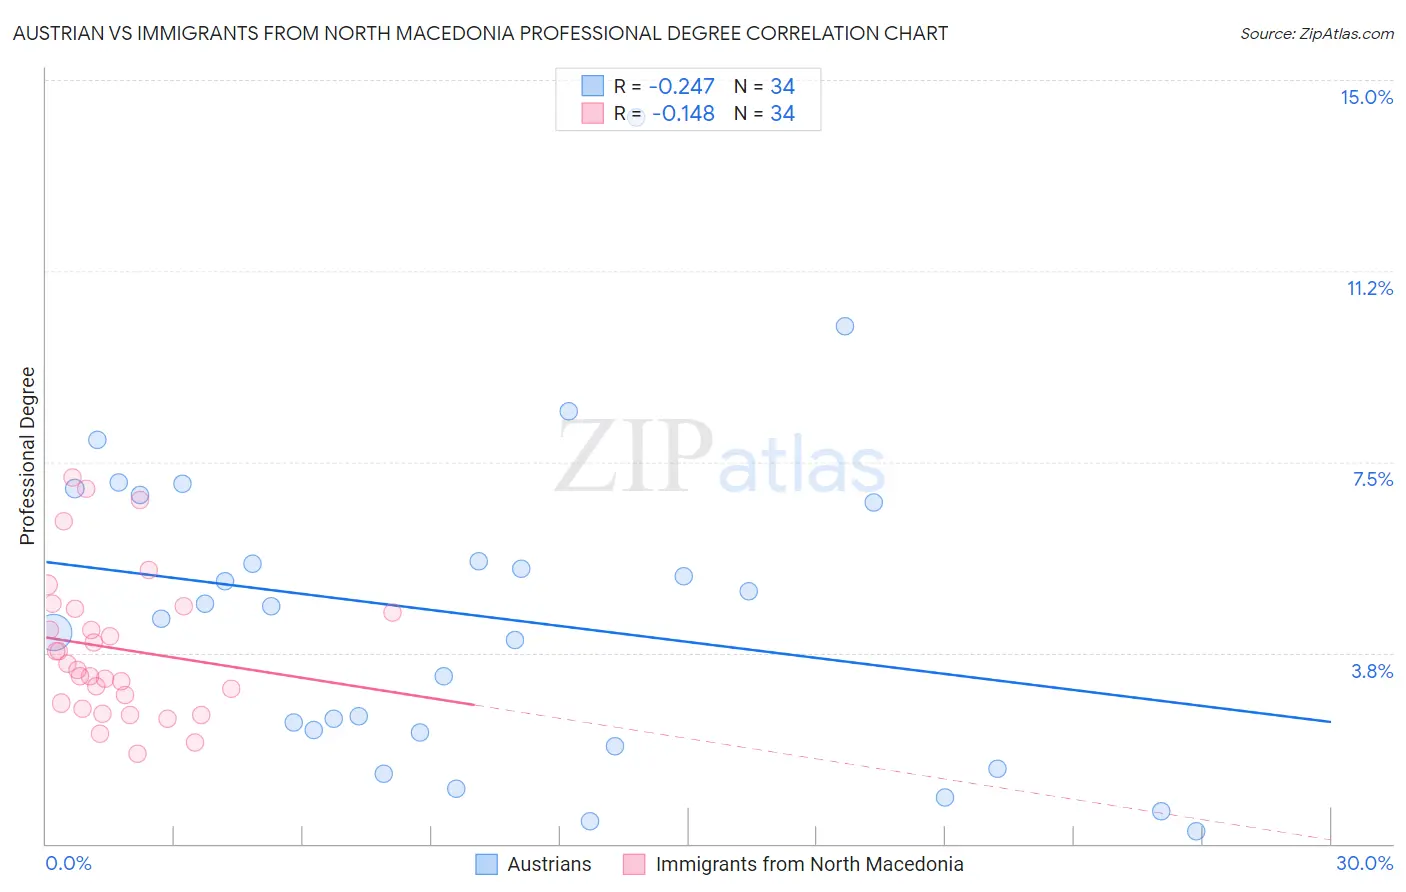
Austrian vs Immigrants from North Macedonia Professional Degree Correlation Chart
The statistical analysis conducted on geographies consisting of 450,559,334 people shows a weak negative correlation between the proportion of Austrians and percentage of population with at least professional degree education in the United States with a correlation coefficient (R) of -0.247 and weighted average of 5.2%. Similarly, the statistical analysis conducted on geographies consisting of 74,021,908 people shows a poor negative correlation between the proportion of Immigrants from North Macedonia and percentage of population with at least professional degree education in the United States with a correlation coefficient (R) of -0.148 and weighted average of 4.2%, a difference of 23.2%.
Professional Degree Correlation Summary
| Measurement | Austrian | Immigrants from North Macedonia |
| Minimum | 0.25% | 1.8% |
| Maximum | 14.3% | 7.2% |
| Range | 14.0% | 5.4% |
| Mean | 4.5% | 3.8% |
| Median | 4.5% | 3.5% |
| Interquartile 25% (IQ1) | 2.2% | 2.8% |
| Interquartile 75% (IQ3) | 6.7% | 4.6% |
| Interquartile Range (IQR) | 4.5% | 1.8% |
| Standard Deviation (Sample) | 3.1% | 1.4% |
| Standard Deviation (Population) | 3.0% | 1.4% |
Similar Demographics by Professional Degree
Demographics Similar to Austrians by Professional Degree
In terms of professional degree, the demographic groups most similar to Austrians are Syrian (5.2%, a difference of 0.020%), Immigrants from Italy (5.2%, a difference of 0.060%), Immigrants from Uzbekistan (5.2%, a difference of 0.37%), Zimbabwean (5.2%, a difference of 0.78%), and Ugandan (5.1%, a difference of 0.82%).
| Demographics | Rating | Rank | Professional Degree |
| Laotians | 99.5 /100 | #91 | Exceptional 5.2% |
| Immigrants | Eastern Europe | 99.5 /100 | #92 | Exceptional 5.2% |
| Northern Europeans | 99.3 /100 | #93 | Exceptional 5.2% |
| Alsatians | 99.3 /100 | #94 | Exceptional 5.2% |
| Zimbabweans | 99.3 /100 | #95 | Exceptional 5.2% |
| Immigrants | Uzbekistan | 99.2 /100 | #96 | Exceptional 5.2% |
| Syrians | 99.1 /100 | #97 | Exceptional 5.2% |
| Austrians | 99.1 /100 | #98 | Exceptional 5.2% |
| Immigrants | Italy | 99.1 /100 | #99 | Exceptional 5.2% |
| Ugandans | 98.8 /100 | #100 | Exceptional 5.1% |
| Immigrants | Egypt | 98.5 /100 | #101 | Exceptional 5.1% |
| Ukrainians | 98.5 /100 | #102 | Exceptional 5.1% |
| Immigrants | Northern Africa | 98.4 /100 | #103 | Exceptional 5.1% |
| Arabs | 98.2 /100 | #104 | Exceptional 5.0% |
| Immigrants | Uganda | 98.2 /100 | #105 | Exceptional 5.0% |
Demographics Similar to Immigrants from North Macedonia by Professional Degree
In terms of professional degree, the demographic groups most similar to Immigrants from North Macedonia are Norwegian (4.2%, a difference of 0.080%), Finnish (4.2%, a difference of 0.36%), Immigrants from Middle Africa (4.2%, a difference of 0.44%), Czechoslovakian (4.2%, a difference of 0.50%), and Spanish (4.2%, a difference of 0.64%).
| Demographics | Rating | Rank | Professional Degree |
| French | 27.1 /100 | #193 | Fair 4.2% |
| Scandinavians | 25.8 /100 | #194 | Fair 4.2% |
| Nigerians | 24.6 /100 | #195 | Fair 4.2% |
| Spanish | 23.0 /100 | #196 | Fair 4.2% |
| Czechoslovakians | 22.4 /100 | #197 | Fair 4.2% |
| Immigrants | Middle Africa | 22.1 /100 | #198 | Fair 4.2% |
| Norwegians | 20.5 /100 | #199 | Fair 4.2% |
| Immigrants | North Macedonia | 20.2 /100 | #200 | Fair 4.2% |
| Finns | 18.7 /100 | #201 | Poor 4.2% |
| Immigrants | Iraq | 17.1 /100 | #202 | Poor 4.2% |
| Panamanians | 15.9 /100 | #203 | Poor 4.1% |
| Barbadians | 15.8 /100 | #204 | Poor 4.1% |
| Somalis | 14.8 /100 | #205 | Poor 4.1% |
| Yugoslavians | 13.4 /100 | #206 | Poor 4.1% |
| Sub-Saharan Africans | 12.8 /100 | #207 | Poor 4.1% |