Ecuadorian vs Taiwanese Professional Degree
COMPARE
Ecuadorian
Taiwanese
Professional Degree
Professional Degree Comparison
Ecuadorians
Taiwanese
3.9%
PROFESSIONAL DEGREE
4.6/ 100
METRIC RATING
231st/ 347
METRIC RANK
5.0%
PROFESSIONAL DEGREE
97.3/ 100
METRIC RATING
112th/ 347
METRIC RANK
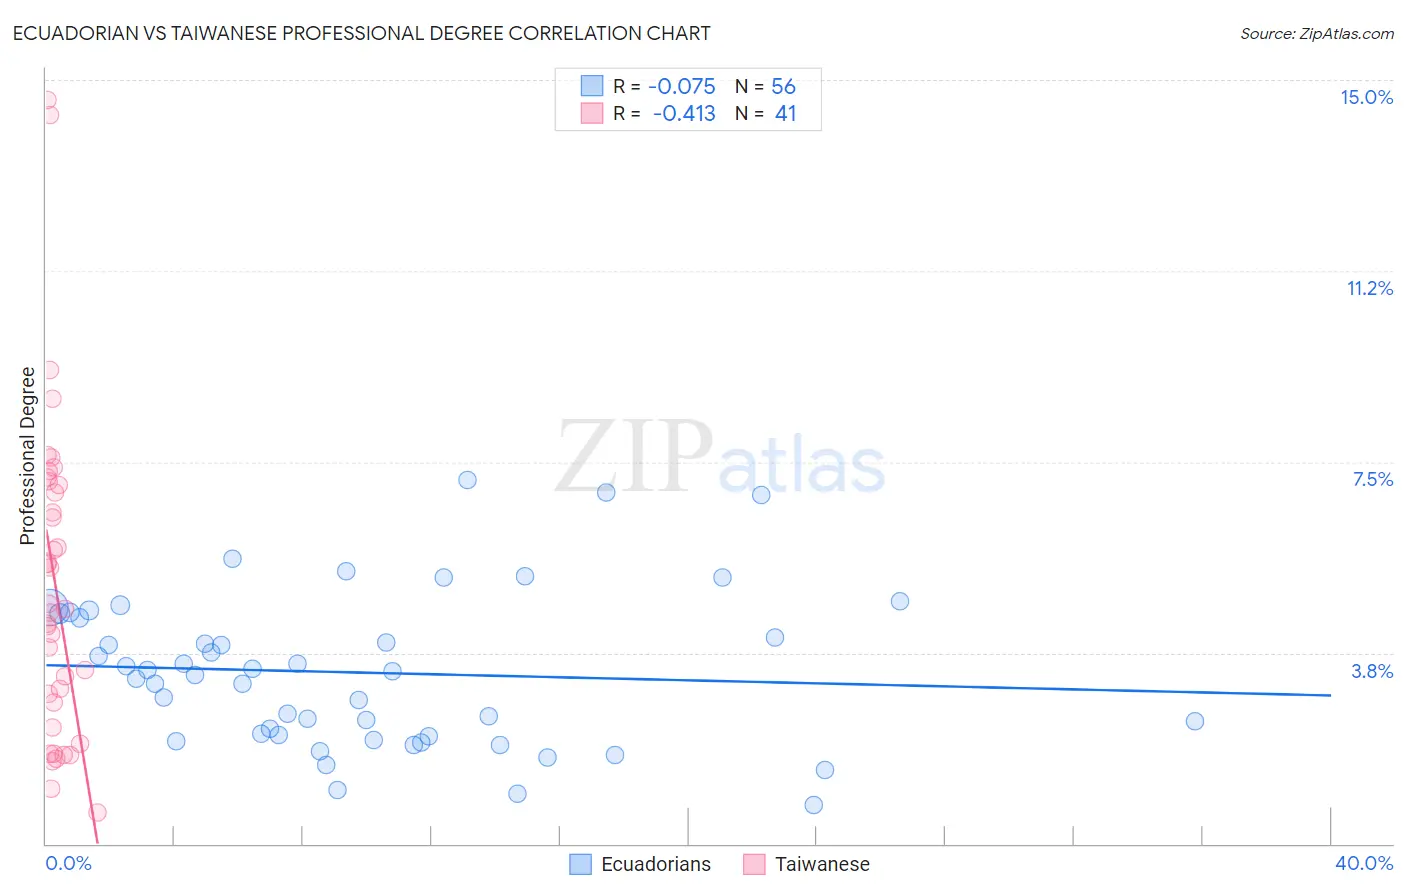
Ecuadorian vs Taiwanese Professional Degree Correlation Chart
The statistical analysis conducted on geographies consisting of 317,407,214 people shows a slight negative correlation between the proportion of Ecuadorians and percentage of population with at least professional degree education in the United States with a correlation coefficient (R) of -0.075 and weighted average of 3.9%. Similarly, the statistical analysis conducted on geographies consisting of 31,716,094 people shows a moderate negative correlation between the proportion of Taiwanese and percentage of population with at least professional degree education in the United States with a correlation coefficient (R) of -0.413 and weighted average of 5.0%, a difference of 27.0%.
Professional Degree Correlation Summary
| Measurement | Ecuadorian | Taiwanese |
| Minimum | 0.77% | 0.61% |
| Maximum | 7.1% | 14.6% |
| Range | 6.4% | 14.0% |
| Mean | 3.4% | 5.1% |
| Median | 3.4% | 4.6% |
| Interquartile 25% (IQ1) | 2.1% | 2.5% |
| Interquartile 75% (IQ3) | 4.5% | 7.1% |
| Interquartile Range (IQR) | 2.4% | 4.6% |
| Standard Deviation (Sample) | 1.5% | 3.2% |
| Standard Deviation (Population) | 1.5% | 3.1% |
Similar Demographics by Professional Degree
Demographics Similar to Ecuadorians by Professional Degree
In terms of professional degree, the demographic groups most similar to Ecuadorians are Cree (3.9%, a difference of 0.21%), Nicaraguan (3.9%, a difference of 0.46%), Immigrants from Philippines (3.9%, a difference of 0.47%), Nonimmigrants (3.9%, a difference of 0.52%), and Immigrants from Barbados (3.9%, a difference of 0.53%).
| Demographics | Rating | Rank | Professional Degree |
| Trinidadians and Tobagonians | 7.1 /100 | #224 | Tragic 4.0% |
| Tlingit-Haida | 6.9 /100 | #225 | Tragic 4.0% |
| German Russians | 6.1 /100 | #226 | Tragic 4.0% |
| Cubans | 5.9 /100 | #227 | Tragic 4.0% |
| Immigrants | West Indies | 5.6 /100 | #228 | Tragic 4.0% |
| Immigrants | Burma/Myanmar | 5.4 /100 | #229 | Tragic 3.9% |
| Nicaraguans | 5.1 /100 | #230 | Tragic 3.9% |
| Ecuadorians | 4.6 /100 | #231 | Tragic 3.9% |
| Cree | 4.3 /100 | #232 | Tragic 3.9% |
| Immigrants | Philippines | 4.1 /100 | #233 | Tragic 3.9% |
| Immigrants | Nonimmigrants | 4.0 /100 | #234 | Tragic 3.9% |
| Immigrants | Barbados | 4.0 /100 | #235 | Tragic 3.9% |
| Spanish Americans | 3.8 /100 | #236 | Tragic 3.9% |
| Immigrants | Trinidad and Tobago | 3.8 /100 | #237 | Tragic 3.9% |
| Colville | 2.6 /100 | #238 | Tragic 3.8% |
Demographics Similar to Taiwanese by Professional Degree
In terms of professional degree, the demographic groups most similar to Taiwanese are Immigrants from Pakistan (5.0%, a difference of 0.020%), Brazilian (5.0%, a difference of 0.22%), Immigrants from Morocco (5.0%, a difference of 0.47%), Moroccan (5.0%, a difference of 0.57%), and Lebanese (5.0%, a difference of 0.96%).
| Demographics | Rating | Rank | Professional Degree |
| Immigrants | Uganda | 98.2 /100 | #105 | Exceptional 5.0% |
| Immigrants | Ukraine | 98.2 /100 | #106 | Exceptional 5.0% |
| Maltese | 98.1 /100 | #107 | Exceptional 5.0% |
| Immigrants | Southern Europe | 98.1 /100 | #108 | Exceptional 5.0% |
| British | 98.0 /100 | #109 | Exceptional 5.0% |
| Lebanese | 98.0 /100 | #110 | Exceptional 5.0% |
| Brazilians | 97.4 /100 | #111 | Exceptional 5.0% |
| Taiwanese | 97.3 /100 | #112 | Exceptional 5.0% |
| Immigrants | Pakistan | 97.2 /100 | #113 | Exceptional 5.0% |
| Immigrants | Morocco | 96.8 /100 | #114 | Exceptional 5.0% |
| Moroccans | 96.8 /100 | #115 | Exceptional 5.0% |
| Venezuelans | 96.3 /100 | #116 | Exceptional 4.9% |
| Immigrants | Syria | 96.0 /100 | #117 | Exceptional 4.9% |
| Croatians | 96.0 /100 | #118 | Exceptional 4.9% |
| Immigrants | Sudan | 95.4 /100 | #119 | Exceptional 4.9% |