Ecuadorian vs Immigrants from China 4th Grade
COMPARE
Ecuadorian
Immigrants from China
4th Grade
4th Grade Comparison
Ecuadorians
Immigrants from China
96.4%
4TH GRADE
0.0/ 100
METRIC RATING
304th/ 347
METRIC RANK
97.0%
4TH GRADE
0.3/ 100
METRIC RATING
266th/ 347
METRIC RANK
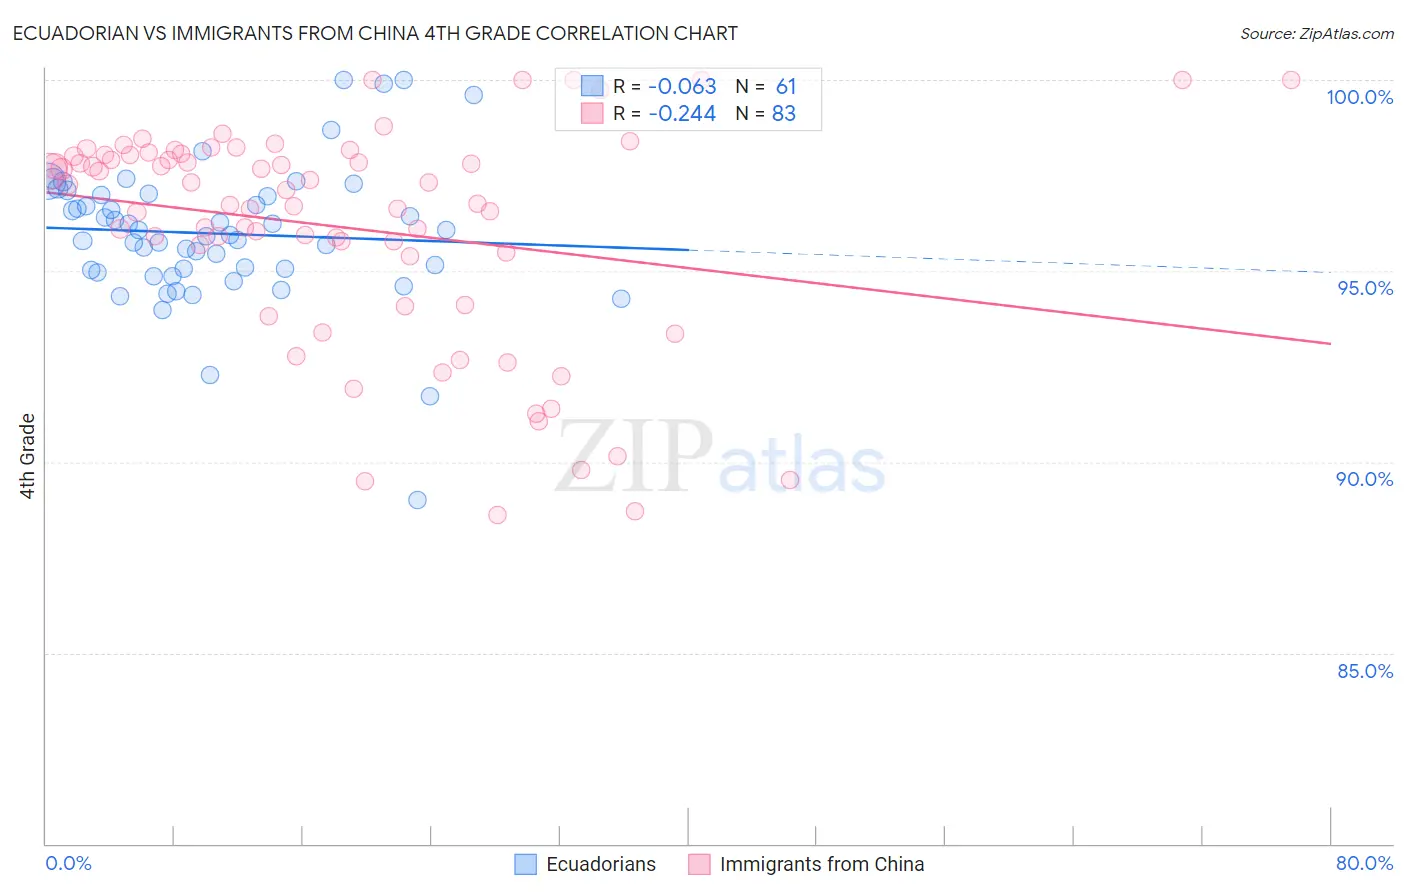
Ecuadorian vs Immigrants from China 4th Grade Correlation Chart
The statistical analysis conducted on geographies consisting of 317,865,723 people shows a slight negative correlation between the proportion of Ecuadorians and percentage of population with at least 4th grade education in the United States with a correlation coefficient (R) of -0.063 and weighted average of 96.4%. Similarly, the statistical analysis conducted on geographies consisting of 457,082,957 people shows a weak negative correlation between the proportion of Immigrants from China and percentage of population with at least 4th grade education in the United States with a correlation coefficient (R) of -0.244 and weighted average of 97.0%, a difference of 0.61%.
4th Grade Correlation Summary
| Measurement | Ecuadorian | Immigrants from China |
| Minimum | 89.0% | 88.6% |
| Maximum | 100.0% | 100.0% |
| Range | 11.0% | 11.4% |
| Mean | 96.0% | 96.1% |
| Median | 96.0% | 97.1% |
| Interquartile 25% (IQ1) | 95.0% | 95.4% |
| Interquartile 75% (IQ3) | 97.0% | 98.0% |
| Interquartile Range (IQR) | 2.0% | 2.7% |
| Standard Deviation (Sample) | 1.8% | 2.9% |
| Standard Deviation (Population) | 1.8% | 2.9% |
Similar Demographics by 4th Grade
Demographics Similar to Ecuadorians by 4th Grade
In terms of 4th grade, the demographic groups most similar to Ecuadorians are Guyanese (96.4%, a difference of 0.010%), Immigrants from Caribbean (96.4%, a difference of 0.020%), Sri Lankan (96.4%, a difference of 0.030%), Immigrants from Cuba (96.4%, a difference of 0.060%), and Immigrants from Haiti (96.3%, a difference of 0.060%).
| Demographics | Rating | Rank | 4th Grade |
| Immigrants | Somalia | 0.0 /100 | #297 | Tragic 96.5% |
| Haitians | 0.0 /100 | #298 | Tragic 96.5% |
| Immigrants | Dominica | 0.0 /100 | #299 | Tragic 96.5% |
| Immigrants | South Eastern Asia | 0.0 /100 | #300 | Tragic 96.5% |
| Immigrants | Immigrants | 0.0 /100 | #301 | Tragic 96.5% |
| Immigrants | Cuba | 0.0 /100 | #302 | Tragic 96.4% |
| Guyanese | 0.0 /100 | #303 | Tragic 96.4% |
| Ecuadorians | 0.0 /100 | #304 | Tragic 96.4% |
| Immigrants | Caribbean | 0.0 /100 | #305 | Tragic 96.4% |
| Sri Lankans | 0.0 /100 | #306 | Tragic 96.4% |
| Immigrants | Haiti | 0.0 /100 | #307 | Tragic 96.3% |
| Immigrants | Laos | 0.0 /100 | #308 | Tragic 96.3% |
| Immigrants | Guyana | 0.0 /100 | #309 | Tragic 96.3% |
| Immigrants | Burma/Myanmar | 0.0 /100 | #310 | Tragic 96.3% |
| Immigrants | Bangladesh | 0.0 /100 | #311 | Tragic 96.2% |
Demographics Similar to Immigrants from China by 4th Grade
In terms of 4th grade, the demographic groups most similar to Immigrants from China are Immigrants from Nigeria (97.0%, a difference of 0.0%), Taiwanese (97.0%, a difference of 0.010%), Armenian (97.0%, a difference of 0.010%), Ghanaian (97.0%, a difference of 0.010%), and Immigrants from Jamaica (97.0%, a difference of 0.020%).
| Demographics | Rating | Rank | 4th Grade |
| Immigrants | Ethiopia | 0.4 /100 | #259 | Tragic 97.0% |
| Immigrants | Sierra Leone | 0.4 /100 | #260 | Tragic 97.0% |
| Immigrants | South America | 0.4 /100 | #261 | Tragic 97.0% |
| West Indians | 0.4 /100 | #262 | Tragic 97.0% |
| Immigrants | Jamaica | 0.3 /100 | #263 | Tragic 97.0% |
| Taiwanese | 0.3 /100 | #264 | Tragic 97.0% |
| Armenians | 0.3 /100 | #265 | Tragic 97.0% |
| Immigrants | China | 0.3 /100 | #266 | Tragic 97.0% |
| Immigrants | Nigeria | 0.3 /100 | #267 | Tragic 97.0% |
| Ghanaians | 0.2 /100 | #268 | Tragic 97.0% |
| Immigrants | Uzbekistan | 0.2 /100 | #269 | Tragic 96.9% |
| Cubans | 0.2 /100 | #270 | Tragic 96.9% |
| Immigrants | Peru | 0.1 /100 | #271 | Tragic 96.9% |
| Fijians | 0.1 /100 | #272 | Tragic 96.9% |
| Immigrants | Cameroon | 0.1 /100 | #273 | Tragic 96.9% |