Ecuadorian vs Immigrants from Asia Nursery School
COMPARE
Ecuadorian
Immigrants from Asia
Nursery School
Nursery School Comparison
Ecuadorians
Immigrants from Asia
97.1%
NURSERY SCHOOL
0.0/ 100
METRIC RATING
304th/ 347
METRIC RANK
97.6%
NURSERY SCHOOL
0.7/ 100
METRIC RATING
255th/ 347
METRIC RANK
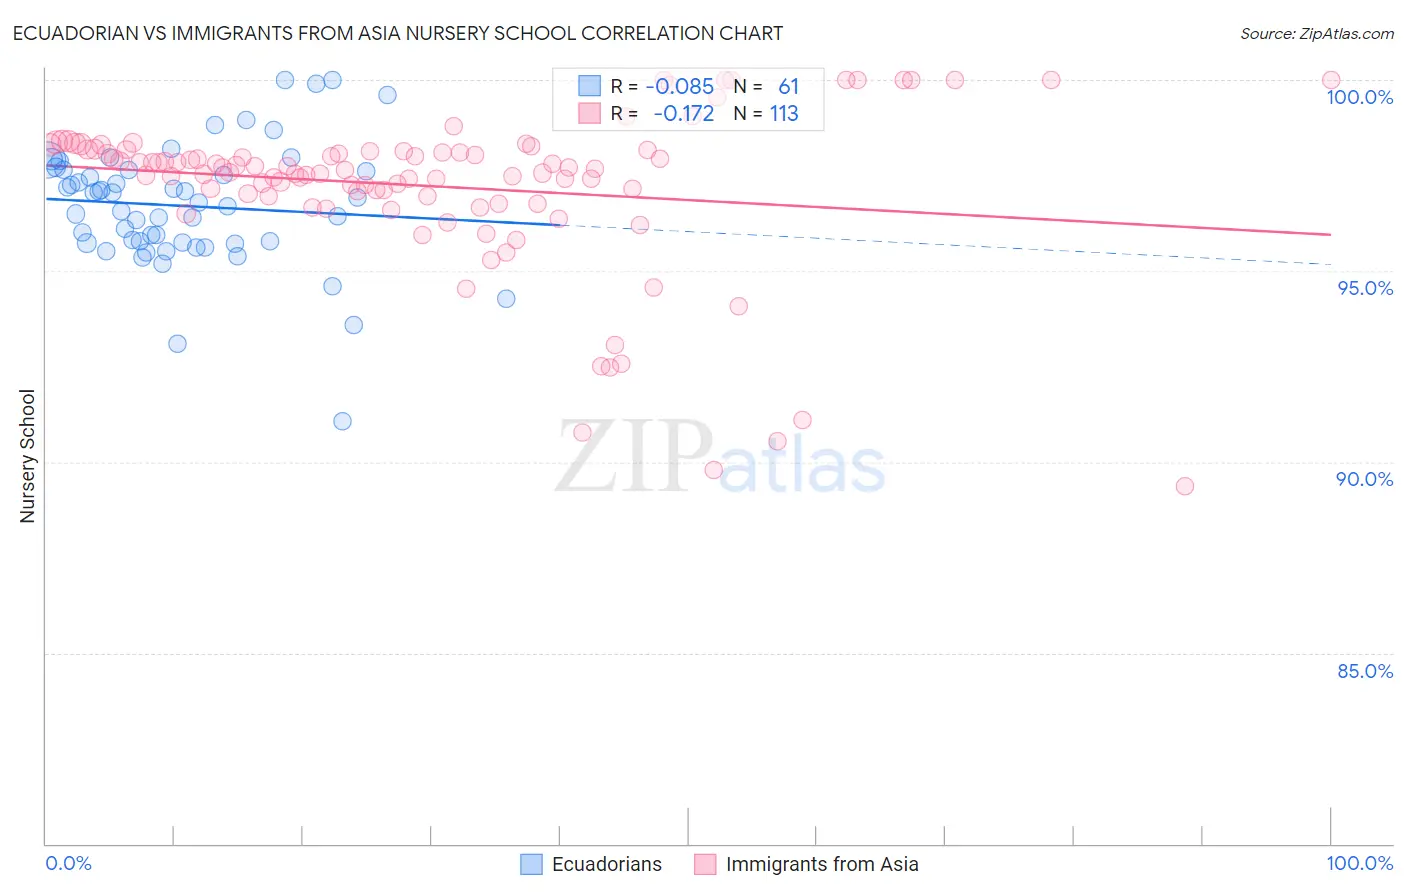
Ecuadorian vs Immigrants from Asia Nursery School Correlation Chart
The statistical analysis conducted on geographies consisting of 317,865,723 people shows a slight negative correlation between the proportion of Ecuadorians and percentage of population with at least nursery school education in the United States with a correlation coefficient (R) of -0.085 and weighted average of 97.1%. Similarly, the statistical analysis conducted on geographies consisting of 549,170,546 people shows a poor negative correlation between the proportion of Immigrants from Asia and percentage of population with at least nursery school education in the United States with a correlation coefficient (R) of -0.172 and weighted average of 97.6%, a difference of 0.56%.
Nursery School Correlation Summary
| Measurement | Ecuadorian | Immigrants from Asia |
| Minimum | 91.1% | 89.4% |
| Maximum | 100.0% | 100.0% |
| Range | 8.9% | 10.6% |
| Mean | 96.7% | 97.2% |
| Median | 96.8% | 97.7% |
| Interquartile 25% (IQ1) | 95.7% | 97.0% |
| Interquartile 75% (IQ3) | 97.7% | 98.2% |
| Interquartile Range (IQR) | 1.9% | 1.2% |
| Standard Deviation (Sample) | 1.6% | 2.1% |
| Standard Deviation (Population) | 1.6% | 2.1% |
Similar Demographics by Nursery School
Demographics Similar to Ecuadorians by Nursery School
In terms of nursery school, the demographic groups most similar to Ecuadorians are Somali (97.1%, a difference of 0.0%), Nicaraguan (97.1%, a difference of 0.010%), Immigrants from Caribbean (97.1%, a difference of 0.040%), Belizean (97.0%, a difference of 0.060%), and Immigrants from South Eastern Asia (97.1%, a difference of 0.070%).
| Demographics | Rating | Rank | Nursery School |
| Immigrants | Cuba | 0.0 /100 | #297 | Tragic 97.2% |
| Central American Indians | 0.0 /100 | #298 | Tragic 97.2% |
| Immigrants | Dominica | 0.0 /100 | #299 | Tragic 97.2% |
| Haitians | 0.0 /100 | #300 | Tragic 97.2% |
| Immigrants | South Eastern Asia | 0.0 /100 | #301 | Tragic 97.1% |
| Immigrants | Caribbean | 0.0 /100 | #302 | Tragic 97.1% |
| Nicaraguans | 0.0 /100 | #303 | Tragic 97.1% |
| Ecuadorians | 0.0 /100 | #304 | Tragic 97.1% |
| Somalis | 0.0 /100 | #305 | Tragic 97.1% |
| Belizeans | 0.0 /100 | #306 | Tragic 97.0% |
| Hispanics or Latinos | 0.0 /100 | #307 | Tragic 97.0% |
| Immigrants | Haiti | 0.0 /100 | #308 | Tragic 97.0% |
| Immigrants | Somalia | 0.0 /100 | #309 | Tragic 97.0% |
| Guyanese | 0.0 /100 | #310 | Tragic 97.0% |
| Immigrants | Azores | 0.0 /100 | #311 | Tragic 97.0% |
Demographics Similar to Immigrants from Asia by Nursery School
In terms of nursery school, the demographic groups most similar to Immigrants from Asia are Immigrants from Congo (97.6%, a difference of 0.0%), Ethiopian (97.6%, a difference of 0.010%), Immigrants from Africa (97.6%, a difference of 0.010%), Immigrants from Iraq (97.6%, a difference of 0.010%), and Yaqui (97.6%, a difference of 0.010%).
| Demographics | Rating | Rank | Nursery School |
| Indians (Asian) | 0.9 /100 | #248 | Tragic 97.6% |
| Immigrants | Eastern Africa | 0.9 /100 | #249 | Tragic 97.6% |
| Immigrants | Senegal | 0.9 /100 | #250 | Tragic 97.6% |
| Ethiopians | 0.8 /100 | #251 | Tragic 97.6% |
| Immigrants | Africa | 0.8 /100 | #252 | Tragic 97.6% |
| Immigrants | Iraq | 0.7 /100 | #253 | Tragic 97.6% |
| Immigrants | Congo | 0.7 /100 | #254 | Tragic 97.6% |
| Immigrants | Asia | 0.7 /100 | #255 | Tragic 97.6% |
| Yaqui | 0.6 /100 | #256 | Tragic 97.6% |
| Immigrants | Colombia | 0.6 /100 | #257 | Tragic 97.6% |
| Jamaicans | 0.6 /100 | #258 | Tragic 97.6% |
| Armenians | 0.4 /100 | #259 | Tragic 97.6% |
| Immigrants | South America | 0.4 /100 | #260 | Tragic 97.6% |
| Cubans | 0.4 /100 | #261 | Tragic 97.6% |
| Immigrants | Ethiopia | 0.4 /100 | #262 | Tragic 97.6% |