Chippewa vs Immigrants from Asia Nursery School
COMPARE
Chippewa
Immigrants from Asia
Nursery School
Nursery School Comparison
Chippewa
Immigrants from Asia
98.5%
NURSERY SCHOOL
99.9/ 100
METRIC RATING
40th/ 347
METRIC RANK
97.6%
NURSERY SCHOOL
0.7/ 100
METRIC RATING
255th/ 347
METRIC RANK
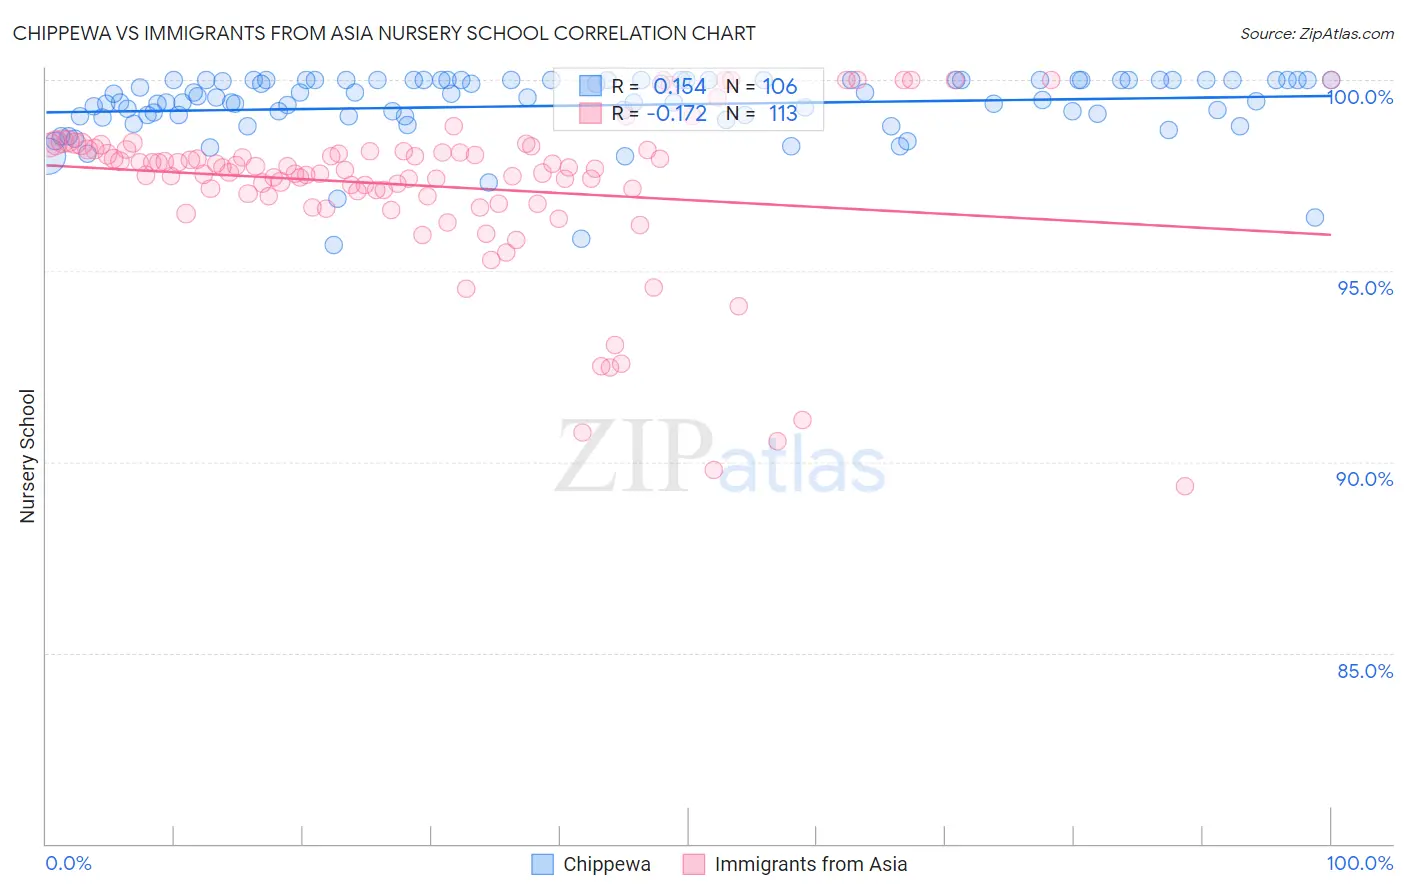
Chippewa vs Immigrants from Asia Nursery School Correlation Chart
The statistical analysis conducted on geographies consisting of 215,065,644 people shows a poor positive correlation between the proportion of Chippewa and percentage of population with at least nursery school education in the United States with a correlation coefficient (R) of 0.154 and weighted average of 98.5%. Similarly, the statistical analysis conducted on geographies consisting of 549,170,546 people shows a poor negative correlation between the proportion of Immigrants from Asia and percentage of population with at least nursery school education in the United States with a correlation coefficient (R) of -0.172 and weighted average of 97.6%, a difference of 0.93%.
Nursery School Correlation Summary
| Measurement | Chippewa | Immigrants from Asia |
| Minimum | 95.7% | 89.4% |
| Maximum | 100.0% | 100.0% |
| Range | 4.3% | 10.6% |
| Mean | 99.3% | 97.2% |
| Median | 99.5% | 97.7% |
| Interquartile 25% (IQ1) | 99.0% | 97.0% |
| Interquartile 75% (IQ3) | 100.0% | 98.2% |
| Interquartile Range (IQR) | 0.95% | 1.2% |
| Standard Deviation (Sample) | 0.87% | 2.1% |
| Standard Deviation (Population) | 0.86% | 2.1% |
Similar Demographics by Nursery School
Demographics Similar to Chippewa by Nursery School
In terms of nursery school, the demographic groups most similar to Chippewa are Latvian (98.5%, a difference of 0.0%), Lumbee (98.5%, a difference of 0.010%), Italian (98.5%, a difference of 0.010%), Luxembourger (98.5%, a difference of 0.010%), and Eastern European (98.5%, a difference of 0.010%).
| Demographics | Rating | Rank | Nursery School |
| Scandinavians | 100.0 /100 | #33 | Exceptional 98.6% |
| Chinese | 100.0 /100 | #34 | Exceptional 98.6% |
| Swiss | 100.0 /100 | #35 | Exceptional 98.6% |
| British | 100.0 /100 | #36 | Exceptional 98.5% |
| Lumbee | 99.9 /100 | #37 | Exceptional 98.5% |
| Italians | 99.9 /100 | #38 | Exceptional 98.5% |
| Latvians | 99.9 /100 | #39 | Exceptional 98.5% |
| Chippewa | 99.9 /100 | #40 | Exceptional 98.5% |
| Luxembourgers | 99.9 /100 | #41 | Exceptional 98.5% |
| Eastern Europeans | 99.9 /100 | #42 | Exceptional 98.5% |
| Native Hawaiians | 99.9 /100 | #43 | Exceptional 98.5% |
| Belgians | 99.9 /100 | #44 | Exceptional 98.5% |
| Northern Europeans | 99.9 /100 | #45 | Exceptional 98.5% |
| Hungarians | 99.9 /100 | #46 | Exceptional 98.5% |
| Czechoslovakians | 99.9 /100 | #47 | Exceptional 98.5% |
Demographics Similar to Immigrants from Asia by Nursery School
In terms of nursery school, the demographic groups most similar to Immigrants from Asia are Immigrants from Congo (97.6%, a difference of 0.0%), Ethiopian (97.6%, a difference of 0.010%), Immigrants from Africa (97.6%, a difference of 0.010%), Immigrants from Iraq (97.6%, a difference of 0.010%), and Yaqui (97.6%, a difference of 0.010%).
| Demographics | Rating | Rank | Nursery School |
| Indians (Asian) | 0.9 /100 | #248 | Tragic 97.6% |
| Immigrants | Eastern Africa | 0.9 /100 | #249 | Tragic 97.6% |
| Immigrants | Senegal | 0.9 /100 | #250 | Tragic 97.6% |
| Ethiopians | 0.8 /100 | #251 | Tragic 97.6% |
| Immigrants | Africa | 0.8 /100 | #252 | Tragic 97.6% |
| Immigrants | Iraq | 0.7 /100 | #253 | Tragic 97.6% |
| Immigrants | Congo | 0.7 /100 | #254 | Tragic 97.6% |
| Immigrants | Asia | 0.7 /100 | #255 | Tragic 97.6% |
| Yaqui | 0.6 /100 | #256 | Tragic 97.6% |
| Immigrants | Colombia | 0.6 /100 | #257 | Tragic 97.6% |
| Jamaicans | 0.6 /100 | #258 | Tragic 97.6% |
| Armenians | 0.4 /100 | #259 | Tragic 97.6% |
| Immigrants | South America | 0.4 /100 | #260 | Tragic 97.6% |
| Cubans | 0.4 /100 | #261 | Tragic 97.6% |
| Immigrants | Ethiopia | 0.4 /100 | #262 | Tragic 97.6% |