Immigrants from Jordan vs American Bachelor's Degree
COMPARE
Immigrants from Jordan
American
Bachelor's Degree
Bachelor's Degree Comparison
Immigrants from Jordan
Americans
40.3%
BACHELOR'S DEGREE
93.4/ 100
METRIC RATING
127th/ 347
METRIC RANK
31.9%
BACHELOR'S DEGREE
0.2/ 100
METRIC RATING
273rd/ 347
METRIC RANK
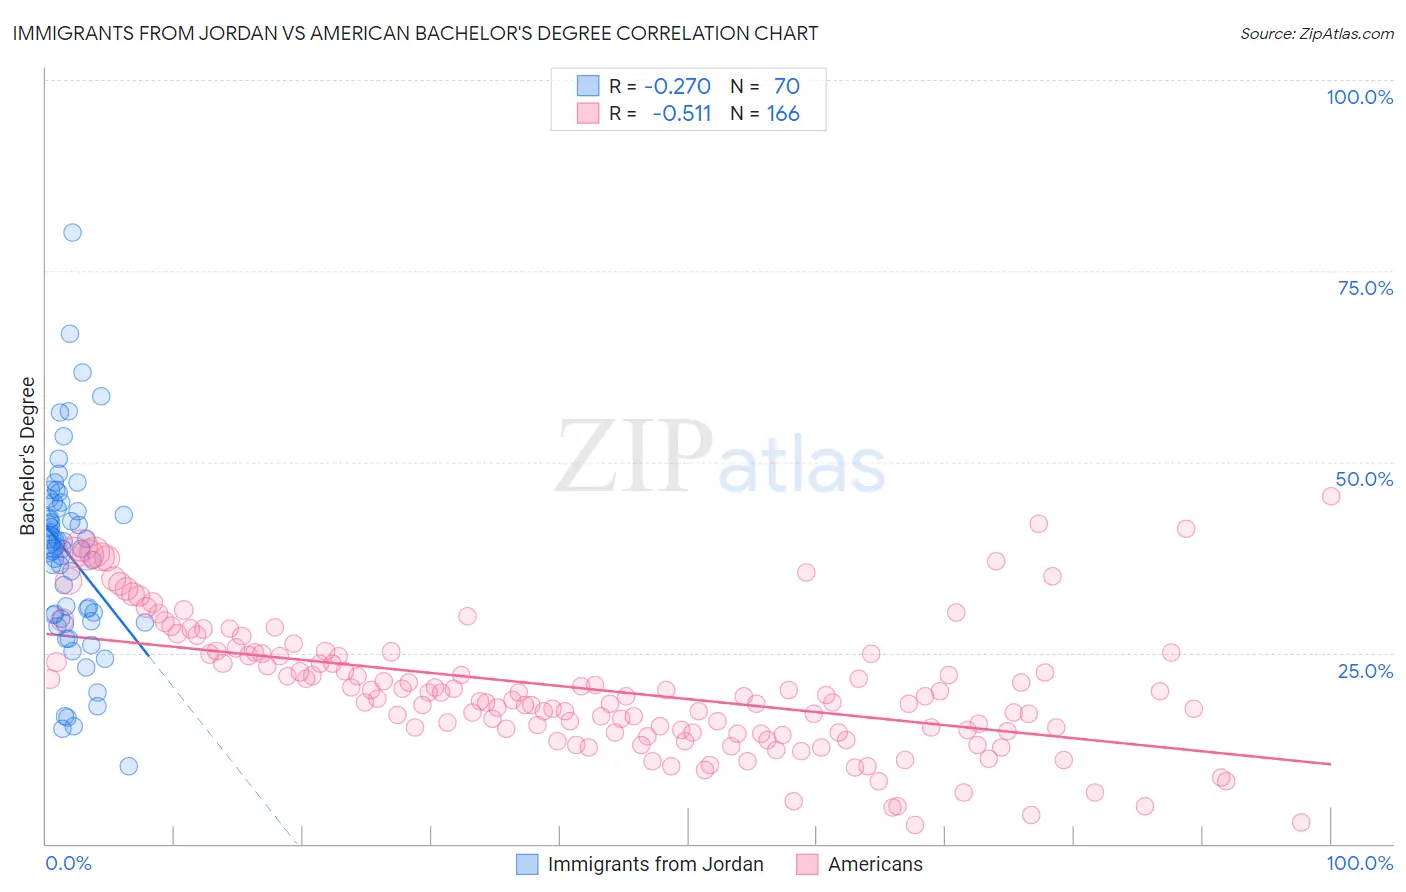
Immigrants from Jordan vs American Bachelor's Degree Correlation Chart
The statistical analysis conducted on geographies consisting of 181,275,733 people shows a weak negative correlation between the proportion of Immigrants from Jordan and percentage of population with at least bachelor's degree education in the United States with a correlation coefficient (R) of -0.270 and weighted average of 40.3%. Similarly, the statistical analysis conducted on geographies consisting of 581,681,572 people shows a substantial negative correlation between the proportion of Americans and percentage of population with at least bachelor's degree education in the United States with a correlation coefficient (R) of -0.511 and weighted average of 31.9%, a difference of 26.4%.
Bachelor's Degree Correlation Summary
| Measurement | Immigrants from Jordan | American |
| Minimum | 10.2% | 2.5% |
| Maximum | 80.0% | 45.5% |
| Range | 69.8% | 43.0% |
| Mean | 37.8% | 20.2% |
| Median | 38.8% | 19.3% |
| Interquartile 25% (IQ1) | 29.5% | 14.6% |
| Interquartile 75% (IQ3) | 43.8% | 24.9% |
| Interquartile Range (IQR) | 14.3% | 10.3% |
| Standard Deviation (Sample) | 12.4% | 8.5% |
| Standard Deviation (Population) | 12.4% | 8.5% |
Similar Demographics by Bachelor's Degree
Demographics Similar to Immigrants from Jordan by Bachelor's Degree
In terms of bachelor's degree, the demographic groups most similar to Immigrants from Jordan are Immigrants from Venezuela (40.2%, a difference of 0.17%), Immigrants from Eastern Africa (40.4%, a difference of 0.28%), British (40.4%, a difference of 0.33%), Serbian (40.1%, a difference of 0.35%), and Immigrants from Eritrea (40.4%, a difference of 0.36%).
| Demographics | Rating | Rank | Bachelor's Degree |
| Venezuelans | 94.7 /100 | #120 | Exceptional 40.5% |
| Moroccans | 94.6 /100 | #121 | Exceptional 40.5% |
| Immigrants | Albania | 94.4 /100 | #122 | Exceptional 40.4% |
| Lebanese | 94.3 /100 | #123 | Exceptional 40.4% |
| Immigrants | Eritrea | 94.3 /100 | #124 | Exceptional 40.4% |
| British | 94.2 /100 | #125 | Exceptional 40.4% |
| Immigrants | Eastern Africa | 94.1 /100 | #126 | Exceptional 40.4% |
| Immigrants | Jordan | 93.4 /100 | #127 | Exceptional 40.3% |
| Immigrants | Venezuela | 92.9 /100 | #128 | Exceptional 40.2% |
| Serbians | 92.4 /100 | #129 | Exceptional 40.1% |
| Sierra Leoneans | 92.2 /100 | #130 | Exceptional 40.1% |
| Italians | 91.9 /100 | #131 | Exceptional 40.1% |
| Taiwanese | 91.1 /100 | #132 | Exceptional 40.0% |
| Immigrants | Southern Europe | 91.1 /100 | #133 | Exceptional 40.0% |
| Assyrians/Chaldeans/Syriacs | 89.4 /100 | #134 | Excellent 39.8% |
Demographics Similar to Americans by Bachelor's Degree
In terms of bachelor's degree, the demographic groups most similar to Americans are Potawatomi (31.9%, a difference of 0.020%), Comanche (31.9%, a difference of 0.12%), Central American (31.9%, a difference of 0.15%), Samoan (31.8%, a difference of 0.15%), and Salvadoran (31.8%, a difference of 0.19%).
| Demographics | Rating | Rank | Bachelor's Degree |
| Immigrants | Dominica | 0.3 /100 | #266 | Tragic 32.5% |
| Cubans | 0.3 /100 | #267 | Tragic 32.5% |
| Immigrants | Portugal | 0.2 /100 | #268 | Tragic 32.2% |
| Immigrants | Belize | 0.2 /100 | #269 | Tragic 32.1% |
| Immigrants | Nicaragua | 0.2 /100 | #270 | Tragic 31.9% |
| Central Americans | 0.2 /100 | #271 | Tragic 31.9% |
| Comanche | 0.2 /100 | #272 | Tragic 31.9% |
| Americans | 0.2 /100 | #273 | Tragic 31.9% |
| Potawatomi | 0.2 /100 | #274 | Tragic 31.9% |
| Samoans | 0.1 /100 | #275 | Tragic 31.8% |
| Salvadorans | 0.1 /100 | #276 | Tragic 31.8% |
| Dominicans | 0.1 /100 | #277 | Tragic 31.8% |
| Marshallese | 0.1 /100 | #278 | Tragic 31.7% |
| Hawaiians | 0.1 /100 | #279 | Tragic 31.6% |
| Immigrants | Laos | 0.1 /100 | #280 | Tragic 31.6% |