Alaska Native vs Afghan Bachelor's Degree
COMPARE
Alaska Native
Afghan
Bachelor's Degree
Bachelor's Degree Comparison
Alaska Natives
Afghans
29.4%
BACHELOR'S DEGREE
0.0/ 100
METRIC RATING
313th/ 347
METRIC RANK
40.8%
BACHELOR'S DEGREE
96.2/ 100
METRIC RATING
114th/ 347
METRIC RANK
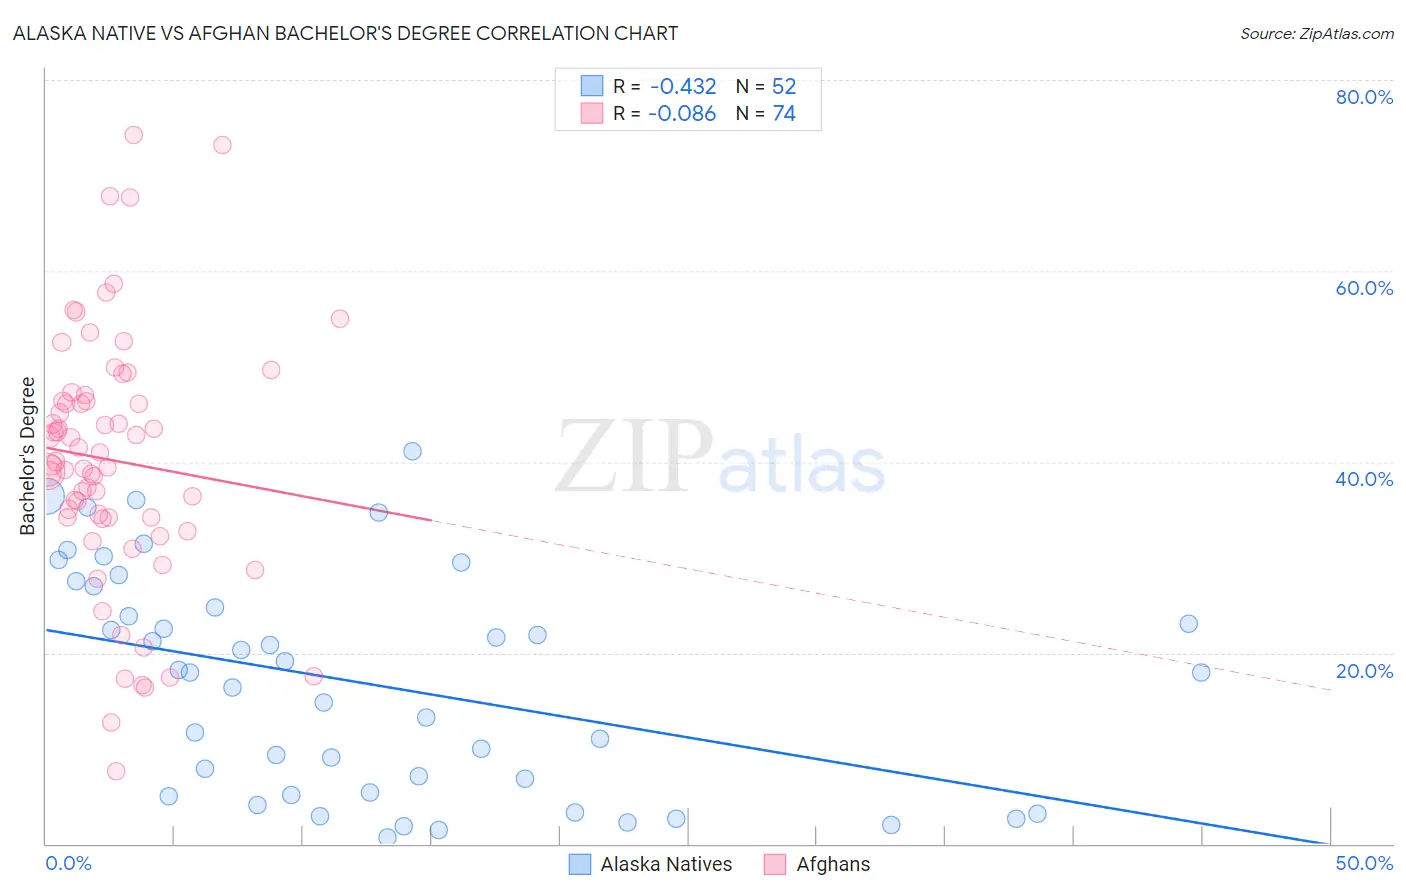
Alaska Native vs Afghan Bachelor's Degree Correlation Chart
The statistical analysis conducted on geographies consisting of 76,776,170 people shows a moderate negative correlation between the proportion of Alaska Natives and percentage of population with at least bachelor's degree education in the United States with a correlation coefficient (R) of -0.432 and weighted average of 29.4%. Similarly, the statistical analysis conducted on geographies consisting of 148,869,794 people shows a slight negative correlation between the proportion of Afghans and percentage of population with at least bachelor's degree education in the United States with a correlation coefficient (R) of -0.086 and weighted average of 40.8%, a difference of 39.0%.
Bachelor's Degree Correlation Summary
| Measurement | Alaska Native | Afghan |
| Minimum | 0.66% | 7.6% |
| Maximum | 41.1% | 74.2% |
| Range | 40.4% | 66.6% |
| Mean | 16.8% | 40.2% |
| Median | 17.9% | 39.8% |
| Interquartile 25% (IQ1) | 5.2% | 34.1% |
| Interquartile 75% (IQ3) | 25.9% | 46.4% |
| Interquartile Range (IQR) | 20.6% | 12.3% |
| Standard Deviation (Sample) | 11.5% | 13.3% |
| Standard Deviation (Population) | 11.4% | 13.2% |
Similar Demographics by Bachelor's Degree
Demographics Similar to Alaska Natives by Bachelor's Degree
In terms of bachelor's degree, the demographic groups most similar to Alaska Natives are Seminole (29.4%, a difference of 0.18%), Choctaw (29.4%, a difference of 0.24%), Shoshone (29.3%, a difference of 0.29%), Cheyenne (29.4%, a difference of 0.31%), and Immigrants from Cabo Verde (29.2%, a difference of 0.37%).
| Demographics | Rating | Rank | Bachelor's Degree |
| Immigrants | Yemen | 0.0 /100 | #306 | Tragic 29.9% |
| Nepalese | 0.0 /100 | #307 | Tragic 29.9% |
| Cajuns | 0.0 /100 | #308 | Tragic 29.6% |
| Hispanics or Latinos | 0.0 /100 | #309 | Tragic 29.6% |
| Cheyenne | 0.0 /100 | #310 | Tragic 29.4% |
| Choctaw | 0.0 /100 | #311 | Tragic 29.4% |
| Seminole | 0.0 /100 | #312 | Tragic 29.4% |
| Alaska Natives | 0.0 /100 | #313 | Tragic 29.4% |
| Shoshone | 0.0 /100 | #314 | Tragic 29.3% |
| Immigrants | Cabo Verde | 0.0 /100 | #315 | Tragic 29.2% |
| Sioux | 0.0 /100 | #316 | Tragic 29.1% |
| Colville | 0.0 /100 | #317 | Tragic 29.0% |
| Yaqui | 0.0 /100 | #318 | Tragic 29.0% |
| Creek | 0.0 /100 | #319 | Tragic 28.9% |
| Kiowa | 0.0 /100 | #320 | Tragic 28.8% |
Demographics Similar to Afghans by Bachelor's Degree
In terms of bachelor's degree, the demographic groups most similar to Afghans are Brazilian (40.8%, a difference of 0.030%), Ugandan (40.8%, a difference of 0.070%), Immigrants from Chile (40.8%, a difference of 0.12%), Albanian (40.9%, a difference of 0.16%), and Arab (40.9%, a difference of 0.24%).
| Demographics | Rating | Rank | Bachelor's Degree |
| Northern Europeans | 96.8 /100 | #107 | Exceptional 41.0% |
| Ukrainians | 96.6 /100 | #108 | Exceptional 40.9% |
| Arabs | 96.6 /100 | #109 | Exceptional 40.9% |
| Albanians | 96.5 /100 | #110 | Exceptional 40.9% |
| Immigrants | Chile | 96.4 /100 | #111 | Exceptional 40.8% |
| Ugandans | 96.3 /100 | #112 | Exceptional 40.8% |
| Brazilians | 96.3 /100 | #113 | Exceptional 40.8% |
| Afghans | 96.2 /100 | #114 | Exceptional 40.8% |
| Palestinians | 95.8 /100 | #115 | Exceptional 40.7% |
| Immigrants | Uganda | 95.7 /100 | #116 | Exceptional 40.7% |
| Austrians | 95.5 /100 | #117 | Exceptional 40.6% |
| Croatians | 95.5 /100 | #118 | Exceptional 40.6% |
| Immigrants | Syria | 94.9 /100 | #119 | Exceptional 40.5% |
| Venezuelans | 94.7 /100 | #120 | Exceptional 40.5% |
| Moroccans | 94.6 /100 | #121 | Exceptional 40.5% |