Eastern European vs Immigrants from Eritrea Unemployment Among Ages 45 to 54 years
COMPARE
Eastern European
Immigrants from Eritrea
Unemployment Among Ages 45 to 54 years
Unemployment Among Ages 45 to 54 years Comparison
Eastern Europeans
Immigrants from Eritrea
4.3%
UNEMPLOYMENT AMONG AGES 45 TO 54 YEARS
97.6/ 100
METRIC RATING
82nd/ 347
METRIC RANK
4.4%
UNEMPLOYMENT AMONG AGES 45 TO 54 YEARS
94.7/ 100
METRIC RATING
100th/ 347
METRIC RANK
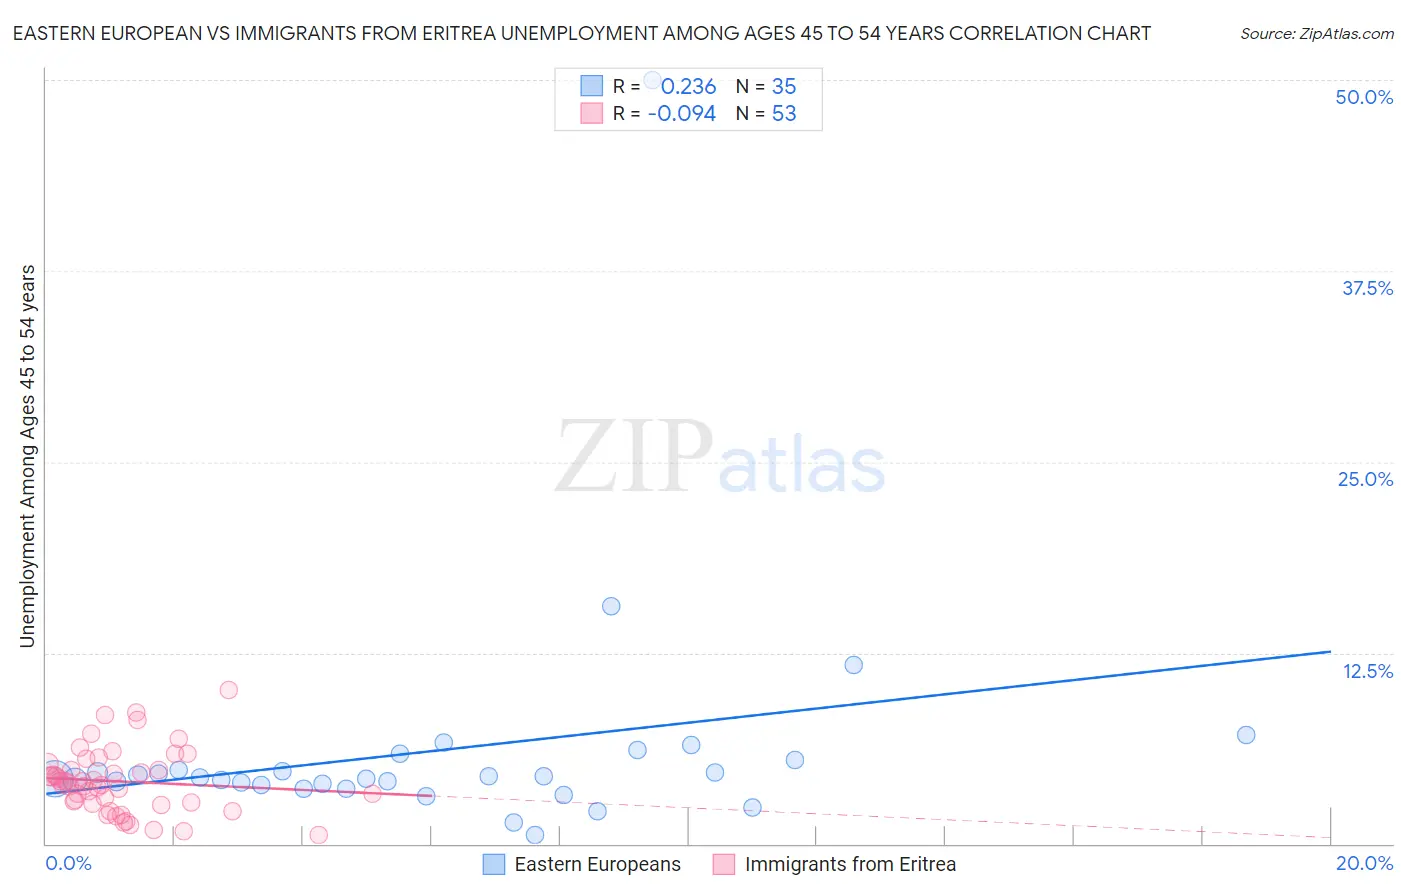
Eastern European vs Immigrants from Eritrea Unemployment Among Ages 45 to 54 years Correlation Chart
The statistical analysis conducted on geographies consisting of 442,490,156 people shows a weak positive correlation between the proportion of Eastern Europeans and unemployment rate among population between the ages 45 and 54 in the United States with a correlation coefficient (R) of 0.236 and weighted average of 4.3%. Similarly, the statistical analysis conducted on geographies consisting of 104,558,577 people shows a slight negative correlation between the proportion of Immigrants from Eritrea and unemployment rate among population between the ages 45 and 54 in the United States with a correlation coefficient (R) of -0.094 and weighted average of 4.4%, a difference of 0.98%.
Unemployment Among Ages 45 to 54 years Correlation Summary
| Measurement | Eastern European | Immigrants from Eritrea |
| Minimum | 0.60% | 0.60% |
| Maximum | 50.0% | 10.0% |
| Range | 49.4% | 9.4% |
| Mean | 6.1% | 4.1% |
| Median | 4.3% | 4.0% |
| Interquartile 25% (IQ1) | 3.9% | 2.7% |
| Interquartile 75% (IQ3) | 5.5% | 5.0% |
| Interquartile Range (IQR) | 1.6% | 2.4% |
| Standard Deviation (Sample) | 8.1% | 2.1% |
| Standard Deviation (Population) | 8.0% | 2.1% |
Demographics Similar to Eastern Europeans and Immigrants from Eritrea by Unemployment Among Ages 45 to 54 years
In terms of unemployment among ages 45 to 54 years, the demographic groups most similar to Eastern Europeans are Immigrants from Micronesia (4.3%, a difference of 0.030%), Australian (4.3%, a difference of 0.080%), Italian (4.3%, a difference of 0.12%), French (4.3%, a difference of 0.12%), and Ethiopian (4.3%, a difference of 0.16%). Similarly, the demographic groups most similar to Immigrants from Eritrea are Immigrants from Burma/Myanmar (4.4%, a difference of 0.030%), Romanian (4.4%, a difference of 0.050%), Immigrants from Canada (4.4%, a difference of 0.060%), Indonesian (4.4%, a difference of 0.18%), and Immigrants from North America (4.4%, a difference of 0.19%).
| Demographics | Rating | Rank | Unemployment Among Ages 45 to 54 years |
| Immigrants | Micronesia | 97.6 /100 | #81 | Exceptional 4.3% |
| Eastern Europeans | 97.6 /100 | #82 | Exceptional 4.3% |
| Australians | 97.4 /100 | #83 | Exceptional 4.3% |
| Italians | 97.3 /100 | #84 | Exceptional 4.3% |
| French | 97.3 /100 | #85 | Exceptional 4.3% |
| Ethiopians | 97.2 /100 | #86 | Exceptional 4.3% |
| Sudanese | 97.0 /100 | #87 | Exceptional 4.3% |
| Immigrants | Turkey | 96.9 /100 | #88 | Exceptional 4.3% |
| Immigrants | Argentina | 96.9 /100 | #89 | Exceptional 4.3% |
| Asians | 96.8 /100 | #90 | Exceptional 4.3% |
| Ukrainians | 96.6 /100 | #91 | Exceptional 4.3% |
| Mongolians | 96.6 /100 | #92 | Exceptional 4.3% |
| Argentineans | 96.5 /100 | #93 | Exceptional 4.3% |
| Immigrants | Malaysia | 96.2 /100 | #94 | Exceptional 4.4% |
| Immigrants | Ethiopia | 96.1 /100 | #95 | Exceptional 4.4% |
| Indonesians | 95.4 /100 | #96 | Exceptional 4.4% |
| Immigrants | Canada | 95.0 /100 | #97 | Exceptional 4.4% |
| Romanians | 94.9 /100 | #98 | Exceptional 4.4% |
| Immigrants | Burma/Myanmar | 94.9 /100 | #99 | Exceptional 4.4% |
| Immigrants | Eritrea | 94.7 /100 | #100 | Exceptional 4.4% |
| Immigrants | North America | 93.9 /100 | #101 | Exceptional 4.4% |