Dutch West Indian vs Immigrants from Bangladesh 3rd Grade
COMPARE
Dutch West Indian
Immigrants from Bangladesh
3rd Grade
3rd Grade Comparison
Dutch West Indians
Immigrants from Bangladesh
97.8%
3RD GRADE
55.5/ 100
METRIC RATING
166th/ 347
METRIC RANK
96.6%
3RD GRADE
0.0/ 100
METRIC RATING
317th/ 347
METRIC RANK
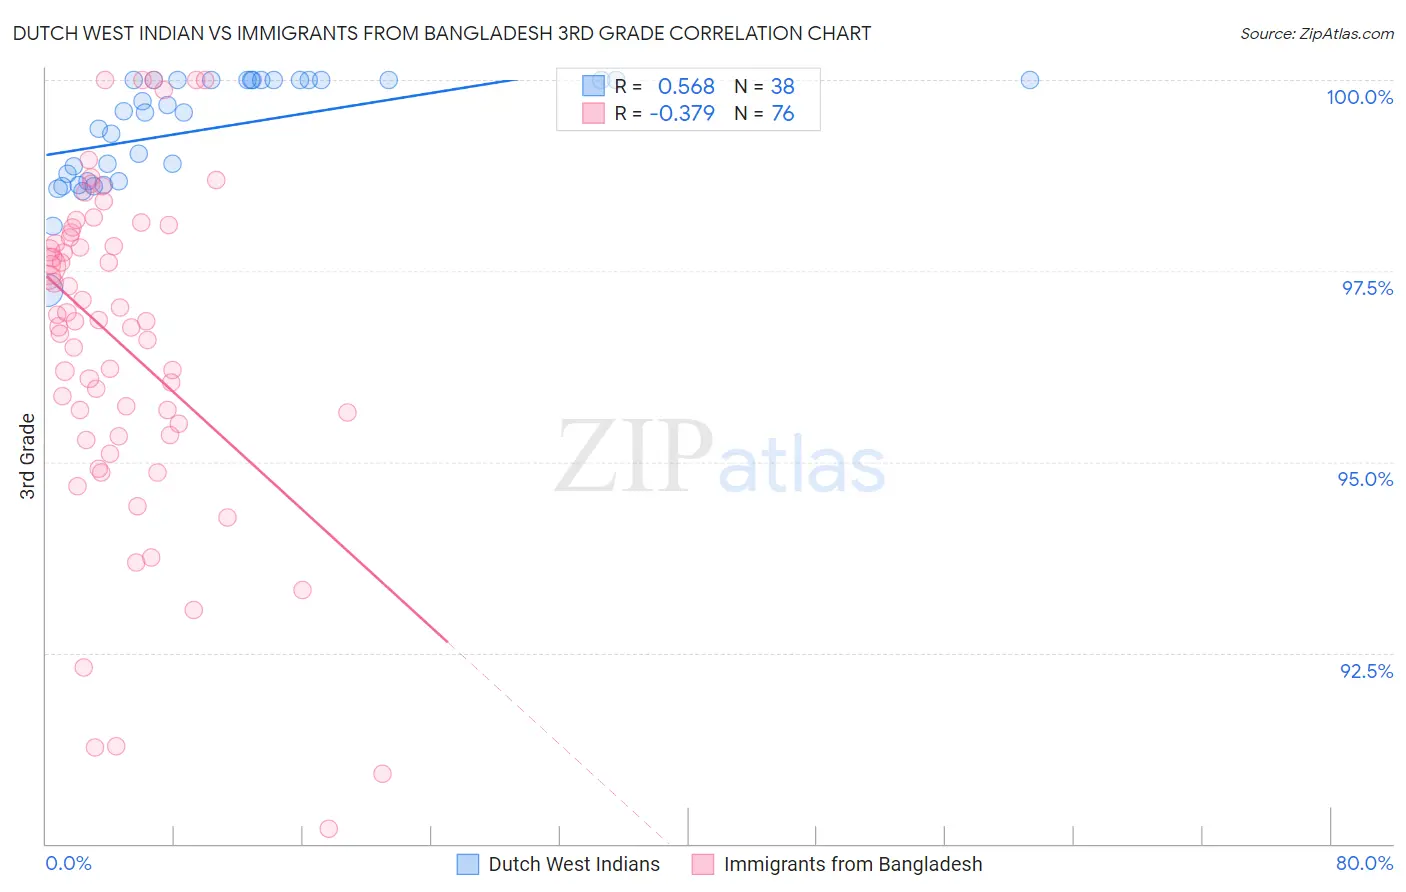
Dutch West Indian vs Immigrants from Bangladesh 3rd Grade Correlation Chart
The statistical analysis conducted on geographies consisting of 85,776,075 people shows a substantial positive correlation between the proportion of Dutch West Indians and percentage of population with at least 3rd grade education in the United States with a correlation coefficient (R) of 0.568 and weighted average of 97.8%. Similarly, the statistical analysis conducted on geographies consisting of 203,681,254 people shows a mild negative correlation between the proportion of Immigrants from Bangladesh and percentage of population with at least 3rd grade education in the United States with a correlation coefficient (R) of -0.379 and weighted average of 96.6%, a difference of 1.3%.
3rd Grade Correlation Summary
| Measurement | Dutch West Indian | Immigrants from Bangladesh |
| Minimum | 97.2% | 90.2% |
| Maximum | 100.0% | 100.0% |
| Range | 2.8% | 9.8% |
| Mean | 99.4% | 96.5% |
| Median | 99.6% | 96.9% |
| Interquartile 25% (IQ1) | 98.7% | 95.4% |
| Interquartile 75% (IQ3) | 100.0% | 98.0% |
| Interquartile Range (IQR) | 1.3% | 2.5% |
| Standard Deviation (Sample) | 0.71% | 2.2% |
| Standard Deviation (Population) | 0.70% | 2.2% |
Similar Demographics by 3rd Grade
Demographics Similar to Dutch West Indians by 3rd Grade
In terms of 3rd grade, the demographic groups most similar to Dutch West Indians are Immigrants from Bosnia and Herzegovina (97.8%, a difference of 0.0%), Ugandan (97.8%, a difference of 0.0%), Chilean (97.8%, a difference of 0.0%), Immigrants from Spain (97.8%, a difference of 0.0%), and Immigrants from Iran (97.8%, a difference of 0.010%).
| Demographics | Rating | Rank | 3rd Grade |
| French American Indians | 60.0 /100 | #159 | Average 97.8% |
| Immigrants | Iran | 59.1 /100 | #160 | Average 97.8% |
| Albanians | 58.8 /100 | #161 | Average 97.8% |
| Immigrants | Jordan | 57.9 /100 | #162 | Average 97.8% |
| Marshallese | 57.2 /100 | #163 | Average 97.8% |
| Immigrants | Bosnia and Herzegovina | 56.2 /100 | #164 | Average 97.8% |
| Ugandans | 56.1 /100 | #165 | Average 97.8% |
| Dutch West Indians | 55.5 /100 | #166 | Average 97.8% |
| Chileans | 55.3 /100 | #167 | Average 97.8% |
| Immigrants | Spain | 54.3 /100 | #168 | Average 97.8% |
| Comanche | 53.8 /100 | #169 | Average 97.8% |
| Brazilians | 53.7 /100 | #170 | Average 97.8% |
| Kenyans | 51.8 /100 | #171 | Average 97.8% |
| Spanish Americans | 51.8 /100 | #172 | Average 97.8% |
| Immigrants | Korea | 50.9 /100 | #173 | Average 97.8% |
Demographics Similar to Immigrants from Bangladesh by 3rd Grade
In terms of 3rd grade, the demographic groups most similar to Immigrants from Bangladesh are Immigrants from Burma/Myanmar (96.6%, a difference of 0.020%), Hispanic or Latino (96.5%, a difference of 0.020%), Immigrants from the Azores (96.6%, a difference of 0.030%), Immigrants from Ecuador (96.6%, a difference of 0.040%), and Belizean (96.6%, a difference of 0.040%).
| Demographics | Rating | Rank | 3rd Grade |
| Cape Verdeans | 0.0 /100 | #310 | Tragic 96.6% |
| Immigrants | Guyana | 0.0 /100 | #311 | Tragic 96.6% |
| Immigrants | Laos | 0.0 /100 | #312 | Tragic 96.6% |
| Immigrants | Ecuador | 0.0 /100 | #313 | Tragic 96.6% |
| Belizeans | 0.0 /100 | #314 | Tragic 96.6% |
| Immigrants | Azores | 0.0 /100 | #315 | Tragic 96.6% |
| Immigrants | Burma/Myanmar | 0.0 /100 | #316 | Tragic 96.6% |
| Immigrants | Bangladesh | 0.0 /100 | #317 | Tragic 96.6% |
| Hispanics or Latinos | 0.0 /100 | #318 | Tragic 96.5% |
| Vietnamese | 0.0 /100 | #319 | Tragic 96.5% |
| Immigrants | Nicaragua | 0.0 /100 | #320 | Tragic 96.5% |
| Indonesians | 0.0 /100 | #321 | Tragic 96.5% |
| Immigrants | Belize | 0.0 /100 | #322 | Tragic 96.5% |
| Hondurans | 0.0 /100 | #323 | Tragic 96.5% |
| Dominicans | 0.0 /100 | #324 | Tragic 96.4% |