Immigrants from Ireland vs Subsaharan African 3rd Grade
COMPARE
Immigrants from Ireland
Subsaharan African
3rd Grade
3rd Grade Comparison
Immigrants from Ireland
Sub-Saharan Africans
98.1%
3RD GRADE
98.2/ 100
METRIC RATING
96th/ 347
METRIC RANK
97.5%
3RD GRADE
3.2/ 100
METRIC RATING
228th/ 347
METRIC RANK
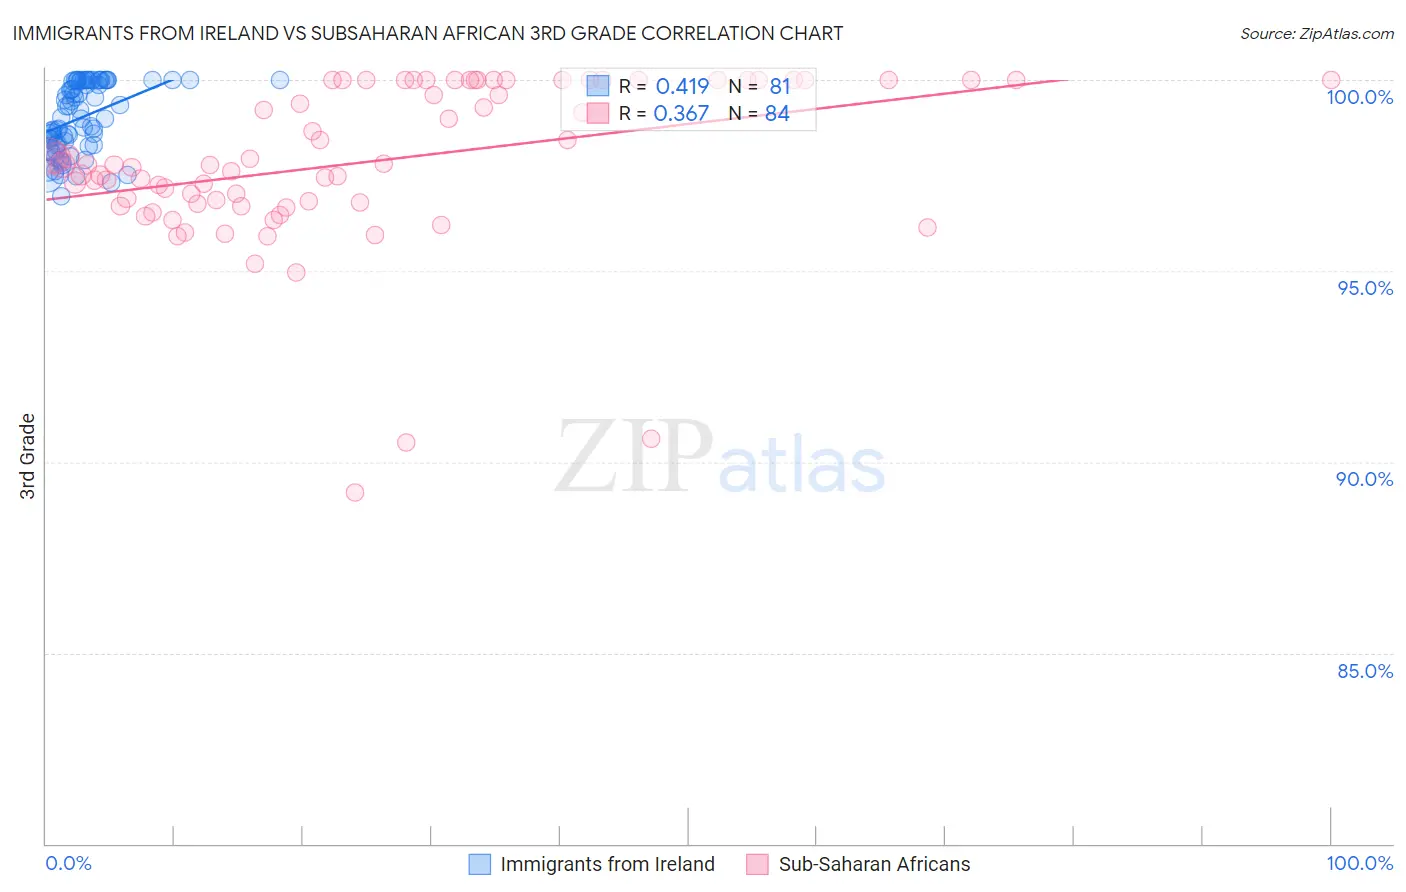
Immigrants from Ireland vs Subsaharan African 3rd Grade Correlation Chart
The statistical analysis conducted on geographies consisting of 240,784,498 people shows a moderate positive correlation between the proportion of Immigrants from Ireland and percentage of population with at least 3rd grade education in the United States with a correlation coefficient (R) of 0.419 and weighted average of 98.1%. Similarly, the statistical analysis conducted on geographies consisting of 508,209,936 people shows a mild positive correlation between the proportion of Sub-Saharan Africans and percentage of population with at least 3rd grade education in the United States with a correlation coefficient (R) of 0.367 and weighted average of 97.5%, a difference of 0.63%.
3rd Grade Correlation Summary
| Measurement | Immigrants from Ireland | Subsaharan African |
| Minimum | 97.0% | 89.2% |
| Maximum | 100.0% | 100.0% |
| Range | 3.0% | 10.8% |
| Mean | 99.0% | 97.9% |
| Median | 99.0% | 97.8% |
| Interquartile 25% (IQ1) | 98.3% | 96.8% |
| Interquartile 75% (IQ3) | 100.0% | 100.0% |
| Interquartile Range (IQR) | 1.7% | 3.2% |
| Standard Deviation (Sample) | 0.89% | 2.1% |
| Standard Deviation (Population) | 0.89% | 2.1% |
Similar Demographics by 3rd Grade
Demographics Similar to Immigrants from Ireland by 3rd Grade
In terms of 3rd grade, the demographic groups most similar to Immigrants from Ireland are South African (98.1%, a difference of 0.0%), Immigrants from Germany (98.1%, a difference of 0.010%), Cypriot (98.1%, a difference of 0.010%), Choctaw (98.1%, a difference of 0.010%), and Romanian (98.1%, a difference of 0.010%).
| Demographics | Rating | Rank | 3rd Grade |
| Delaware | 98.8 /100 | #89 | Exceptional 98.1% |
| Zimbabweans | 98.8 /100 | #90 | Exceptional 98.1% |
| Hopi | 98.7 /100 | #91 | Exceptional 98.1% |
| Immigrants | South Africa | 98.7 /100 | #92 | Exceptional 98.1% |
| Immigrants | Western Europe | 98.7 /100 | #93 | Exceptional 98.1% |
| Immigrants | Germany | 98.4 /100 | #94 | Exceptional 98.1% |
| Cypriots | 98.4 /100 | #95 | Exceptional 98.1% |
| Immigrants | Ireland | 98.2 /100 | #96 | Exceptional 98.1% |
| South Africans | 98.2 /100 | #97 | Exceptional 98.1% |
| Choctaw | 98.0 /100 | #98 | Exceptional 98.1% |
| Romanians | 98.0 /100 | #99 | Exceptional 98.1% |
| Cree | 97.9 /100 | #100 | Exceptional 98.1% |
| Puget Sound Salish | 97.9 /100 | #101 | Exceptional 98.1% |
| Immigrants | Nonimmigrants | 97.8 /100 | #102 | Exceptional 98.1% |
| Yugoslavians | 97.7 /100 | #103 | Exceptional 98.1% |
Demographics Similar to Sub-Saharan Africans by 3rd Grade
In terms of 3rd grade, the demographic groups most similar to Sub-Saharan Africans are Immigrants from Sudan (97.5%, a difference of 0.010%), Senegalese (97.5%, a difference of 0.010%), Immigrants from Pakistan (97.5%, a difference of 0.010%), Immigrants from Costa Rica (97.5%, a difference of 0.010%), and Sudanese (97.5%, a difference of 0.020%).
| Demographics | Rating | Rank | 3rd Grade |
| Uruguayans | 5.0 /100 | #221 | Tragic 97.5% |
| Sierra Leoneans | 4.6 /100 | #222 | Tragic 97.5% |
| Immigrants | Syria | 4.4 /100 | #223 | Tragic 97.5% |
| Bahamians | 4.4 /100 | #224 | Tragic 97.5% |
| Tongans | 4.3 /100 | #225 | Tragic 97.5% |
| Sudanese | 4.1 /100 | #226 | Tragic 97.5% |
| Immigrants | Sudan | 3.4 /100 | #227 | Tragic 97.5% |
| Sub-Saharan Africans | 3.2 /100 | #228 | Tragic 97.5% |
| Senegalese | 3.0 /100 | #229 | Tragic 97.5% |
| Immigrants | Pakistan | 2.7 /100 | #230 | Tragic 97.5% |
| Immigrants | Costa Rica | 2.7 /100 | #231 | Tragic 97.5% |
| Immigrants | Western Asia | 2.6 /100 | #232 | Tragic 97.5% |
| Immigrants | Malaysia | 2.4 /100 | #233 | Tragic 97.5% |
| Immigrants | Eastern Asia | 1.9 /100 | #234 | Tragic 97.4% |
| Immigrants | Iraq | 1.8 /100 | #235 | Tragic 97.4% |