Dutch West Indian vs Delaware Nursery School
COMPARE
Dutch West Indian
Delaware
Nursery School
Nursery School Comparison
Dutch West Indians
Delaware
98.0%
NURSERY SCHOOL
70.2/ 100
METRIC RATING
152nd/ 347
METRIC RANK
98.3%
NURSERY SCHOOL
99.3/ 100
METRIC RATING
78th/ 347
METRIC RANK
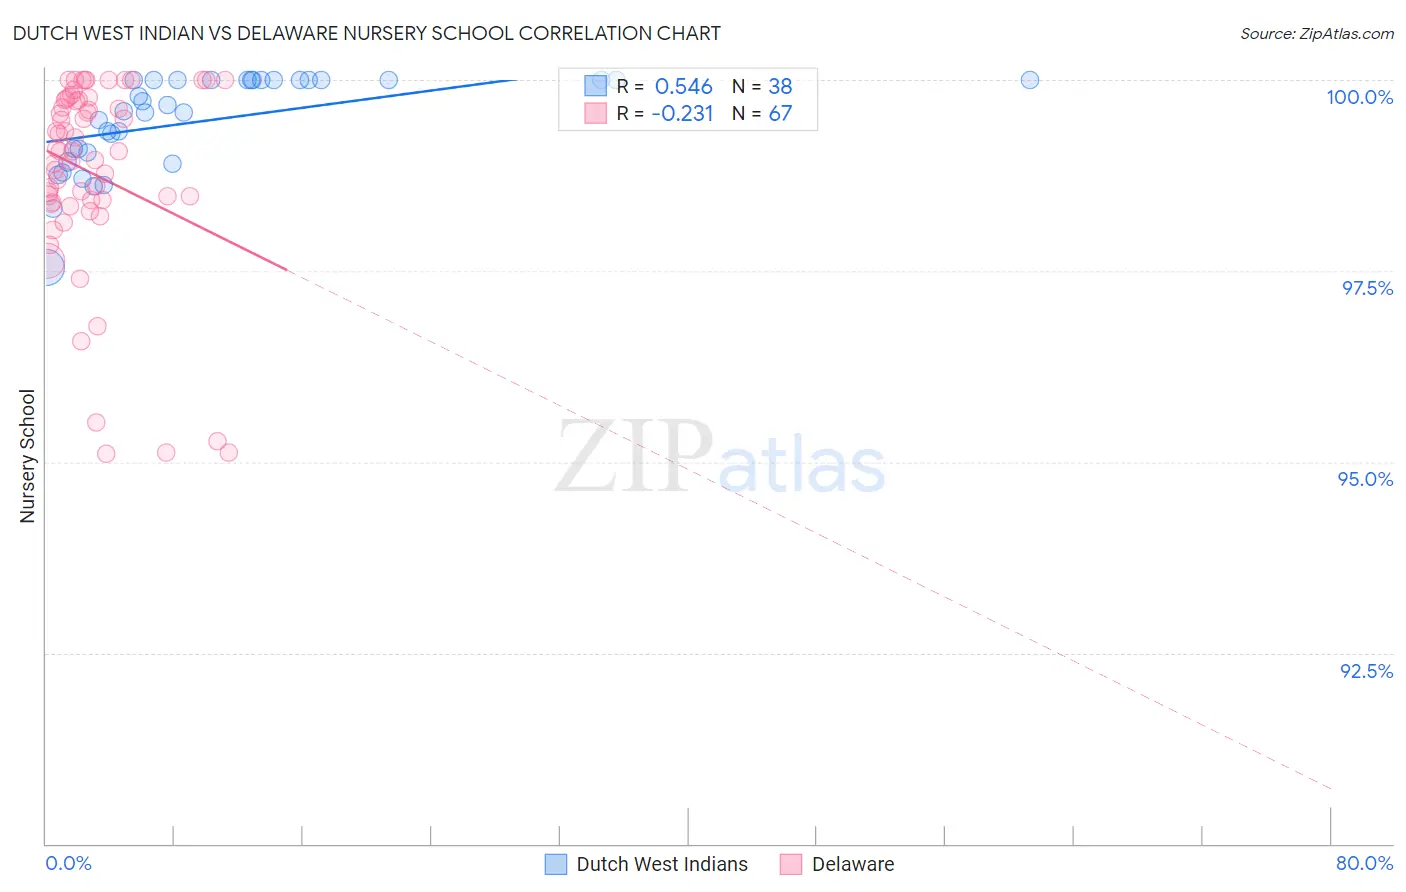
Dutch West Indian vs Delaware Nursery School Correlation Chart
The statistical analysis conducted on geographies consisting of 85,776,075 people shows a substantial positive correlation between the proportion of Dutch West Indians and percentage of population with at least nursery school education in the United States with a correlation coefficient (R) of 0.546 and weighted average of 98.0%. Similarly, the statistical analysis conducted on geographies consisting of 96,234,470 people shows a weak negative correlation between the proportion of Delaware and percentage of population with at least nursery school education in the United States with a correlation coefficient (R) of -0.231 and weighted average of 98.3%, a difference of 0.31%.
Nursery School Correlation Summary
| Measurement | Dutch West Indian | Delaware |
| Minimum | 97.6% | 95.1% |
| Maximum | 100.0% | 100.0% |
| Range | 2.4% | 4.9% |
| Mean | 99.5% | 98.8% |
| Median | 99.6% | 99.1% |
| Interquartile 25% (IQ1) | 99.0% | 98.4% |
| Interquartile 75% (IQ3) | 100.0% | 99.7% |
| Interquartile Range (IQR) | 0.95% | 1.3% |
| Standard Deviation (Sample) | 0.61% | 1.3% |
| Standard Deviation (Population) | 0.60% | 1.3% |
Similar Demographics by Nursery School
Demographics Similar to Dutch West Indians by Nursery School
In terms of nursery school, the demographic groups most similar to Dutch West Indians are Immigrants from Moldova (98.0%, a difference of 0.0%), Apache (98.1%, a difference of 0.010%), Jordanian (98.1%, a difference of 0.010%), Soviet Union (98.0%, a difference of 0.010%), and Immigrants from Iran (98.0%, a difference of 0.010%).
| Demographics | Rating | Rank | Nursery School |
| Immigrants | Israel | 78.5 /100 | #145 | Good 98.1% |
| Filipinos | 78.5 /100 | #146 | Good 98.1% |
| Hmong | 75.7 /100 | #147 | Good 98.1% |
| Immigrants | Greece | 75.4 /100 | #148 | Good 98.1% |
| Apache | 73.2 /100 | #149 | Good 98.1% |
| Jordanians | 72.9 /100 | #150 | Good 98.1% |
| Soviet Union | 71.6 /100 | #151 | Good 98.0% |
| Dutch West Indians | 70.2 /100 | #152 | Good 98.0% |
| Immigrants | Moldova | 69.6 /100 | #153 | Good 98.0% |
| Immigrants | Iran | 68.7 /100 | #154 | Good 98.0% |
| Immigrants | South Central Asia | 66.7 /100 | #155 | Good 98.0% |
| Venezuelans | 66.6 /100 | #156 | Good 98.0% |
| Comanche | 66.0 /100 | #157 | Good 98.0% |
| Immigrants | North Macedonia | 65.7 /100 | #158 | Good 98.0% |
| French American Indians | 62.1 /100 | #159 | Good 98.0% |
Demographics Similar to Delaware by Nursery School
In terms of nursery school, the demographic groups most similar to Delaware are Cherokee (98.3%, a difference of 0.0%), Immigrants from England (98.3%, a difference of 0.0%), Immigrants from Lithuania (98.3%, a difference of 0.0%), Immigrants from Belgium (98.3%, a difference of 0.0%), and Shoshone (98.3%, a difference of 0.0%).
| Demographics | Rating | Rank | Nursery School |
| Serbians | 99.6 /100 | #71 | Exceptional 98.4% |
| Chickasaw | 99.6 /100 | #72 | Exceptional 98.4% |
| Cajuns | 99.4 /100 | #73 | Exceptional 98.4% |
| Immigrants | Netherlands | 99.4 /100 | #74 | Exceptional 98.4% |
| Cherokee | 99.3 /100 | #75 | Exceptional 98.3% |
| Immigrants | England | 99.3 /100 | #76 | Exceptional 98.3% |
| Immigrants | Lithuania | 99.3 /100 | #77 | Exceptional 98.3% |
| Delaware | 99.3 /100 | #78 | Exceptional 98.3% |
| Immigrants | Belgium | 99.3 /100 | #79 | Exceptional 98.3% |
| Shoshone | 99.3 /100 | #80 | Exceptional 98.3% |
| Icelanders | 99.2 /100 | #81 | Exceptional 98.3% |
| Potawatomi | 99.2 /100 | #82 | Exceptional 98.3% |
| Osage | 99.1 /100 | #83 | Exceptional 98.3% |
| Immigrants | Denmark | 99.1 /100 | #84 | Exceptional 98.3% |
| Immigrants | Sweden | 99.1 /100 | #85 | Exceptional 98.3% |