Dominican vs Immigrants from Caribbean 4th Grade
COMPARE
Dominican
Immigrants from Caribbean
4th Grade
4th Grade Comparison
Dominicans
Immigrants from Caribbean
96.0%
4TH GRADE
0.0/ 100
METRIC RATING
325th/ 347
METRIC RANK
96.4%
4TH GRADE
0.0/ 100
METRIC RATING
305th/ 347
METRIC RANK
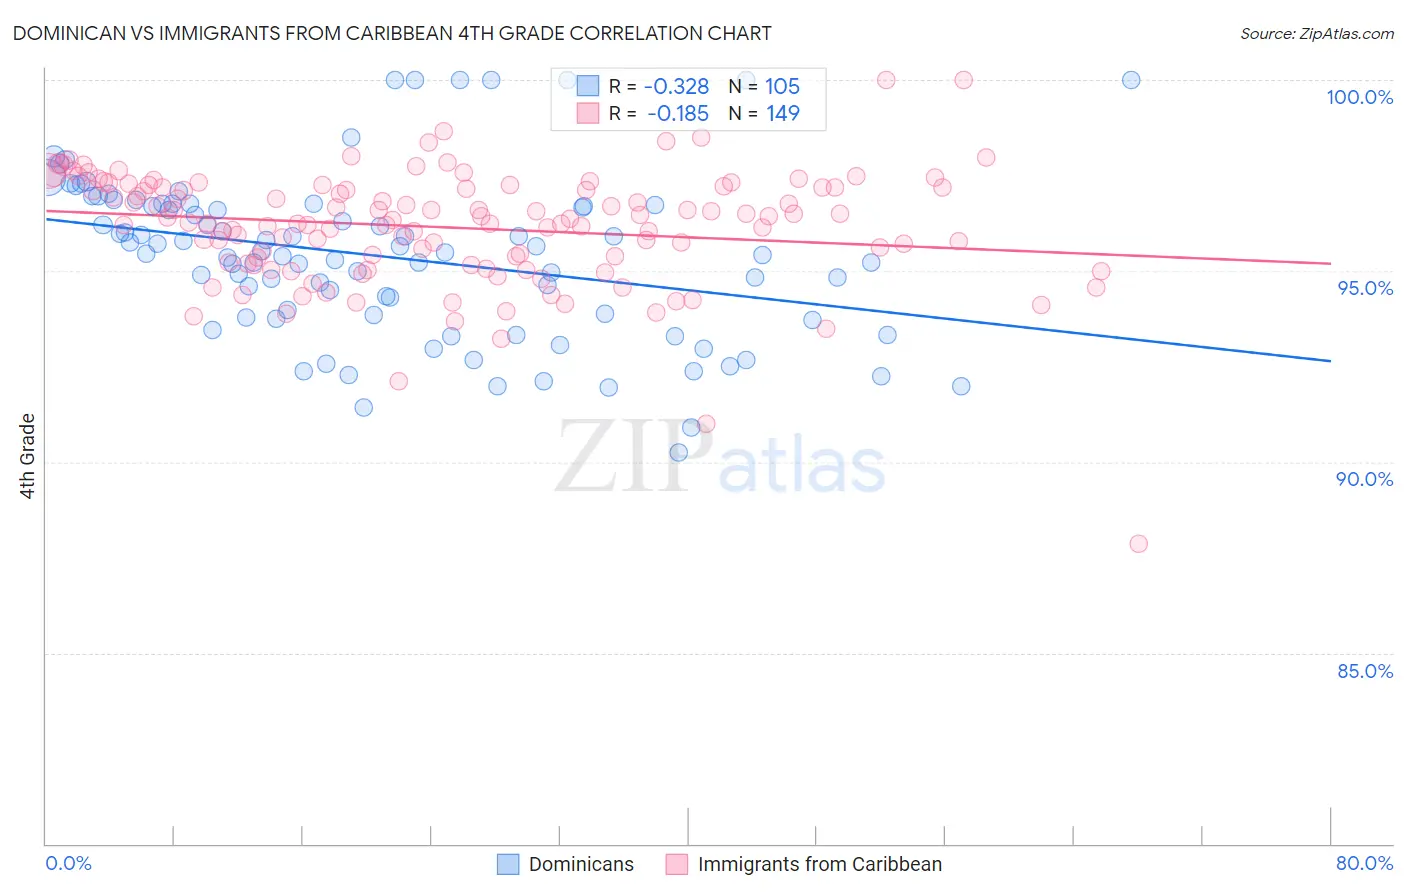
Dominican vs Immigrants from Caribbean 4th Grade Correlation Chart
The statistical analysis conducted on geographies consisting of 355,142,603 people shows a mild negative correlation between the proportion of Dominicans and percentage of population with at least 4th grade education in the United States with a correlation coefficient (R) of -0.328 and weighted average of 96.0%. Similarly, the statistical analysis conducted on geographies consisting of 450,065,262 people shows a poor negative correlation between the proportion of Immigrants from Caribbean and percentage of population with at least 4th grade education in the United States with a correlation coefficient (R) of -0.185 and weighted average of 96.4%, a difference of 0.40%.
4th Grade Correlation Summary
| Measurement | Dominican | Immigrants from Caribbean |
| Minimum | 90.2% | 87.9% |
| Maximum | 100.0% | 100.0% |
| Range | 9.8% | 12.1% |
| Mean | 95.4% | 96.1% |
| Median | 95.5% | 96.3% |
| Interquartile 25% (IQ1) | 93.8% | 95.2% |
| Interquartile 75% (IQ3) | 96.7% | 97.2% |
| Interquartile Range (IQR) | 2.9% | 2.0% |
| Standard Deviation (Sample) | 2.1% | 1.5% |
| Standard Deviation (Population) | 2.1% | 1.5% |
Demographics Similar to Dominicans and Immigrants from Caribbean by 4th Grade
In terms of 4th grade, the demographic groups most similar to Dominicans are Immigrants from Belize (96.0%, a difference of 0.010%), Immigrants from Nicaragua (96.0%, a difference of 0.020%), Japanese (96.0%, a difference of 0.040%), Immigrants from Vietnam (96.0%, a difference of 0.040%), and Bangladeshi (96.1%, a difference of 0.13%). Similarly, the demographic groups most similar to Immigrants from Caribbean are Sri Lankan (96.4%, a difference of 0.010%), Immigrants from Haiti (96.3%, a difference of 0.040%), Immigrants from Laos (96.3%, a difference of 0.050%), Immigrants from Guyana (96.3%, a difference of 0.050%), and Immigrants from Burma/Myanmar (96.3%, a difference of 0.080%).
| Demographics | Rating | Rank | 4th Grade |
| Immigrants | Caribbean | 0.0 /100 | #305 | Tragic 96.4% |
| Sri Lankans | 0.0 /100 | #306 | Tragic 96.4% |
| Immigrants | Haiti | 0.0 /100 | #307 | Tragic 96.3% |
| Immigrants | Laos | 0.0 /100 | #308 | Tragic 96.3% |
| Immigrants | Guyana | 0.0 /100 | #309 | Tragic 96.3% |
| Immigrants | Burma/Myanmar | 0.0 /100 | #310 | Tragic 96.3% |
| Immigrants | Bangladesh | 0.0 /100 | #311 | Tragic 96.2% |
| Cape Verdeans | 0.0 /100 | #312 | Tragic 96.2% |
| Indonesians | 0.0 /100 | #313 | Tragic 96.2% |
| Vietnamese | 0.0 /100 | #314 | Tragic 96.2% |
| Nicaraguans | 0.0 /100 | #315 | Tragic 96.2% |
| Immigrants | Ecuador | 0.0 /100 | #316 | Tragic 96.2% |
| Central American Indians | 0.0 /100 | #317 | Tragic 96.2% |
| Immigrants | Azores | 0.0 /100 | #318 | Tragic 96.1% |
| Belizeans | 0.0 /100 | #319 | Tragic 96.1% |
| Bangladeshis | 0.0 /100 | #320 | Tragic 96.1% |
| Japanese | 0.0 /100 | #321 | Tragic 96.0% |
| Immigrants | Vietnam | 0.0 /100 | #322 | Tragic 96.0% |
| Immigrants | Nicaragua | 0.0 /100 | #323 | Tragic 96.0% |
| Immigrants | Belize | 0.0 /100 | #324 | Tragic 96.0% |
| Dominicans | 0.0 /100 | #325 | Tragic 96.0% |