Dominican vs Dutch 4th Grade
COMPARE
Dominican
Dutch
4th Grade
4th Grade Comparison
Dominicans
Dutch
96.0%
4TH GRADE
0.0/ 100
METRIC RATING
325th/ 347
METRIC RANK
98.4%
4TH GRADE
100.0/ 100
METRIC RATING
15th/ 347
METRIC RANK
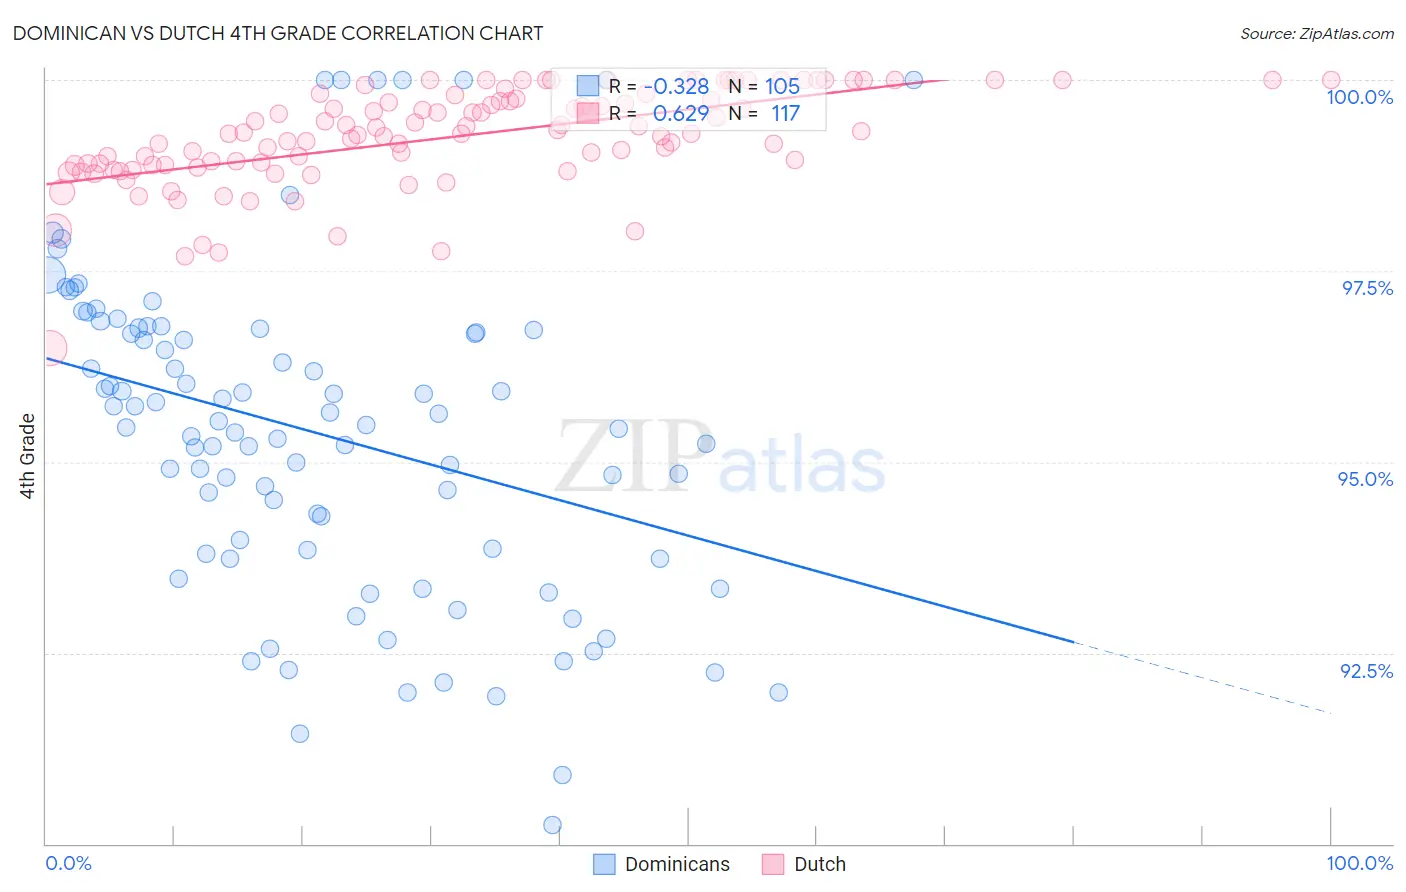
Dominican vs Dutch 4th Grade Correlation Chart
The statistical analysis conducted on geographies consisting of 355,142,603 people shows a mild negative correlation between the proportion of Dominicans and percentage of population with at least 4th grade education in the United States with a correlation coefficient (R) of -0.328 and weighted average of 96.0%. Similarly, the statistical analysis conducted on geographies consisting of 554,359,260 people shows a significant positive correlation between the proportion of Dutch and percentage of population with at least 4th grade education in the United States with a correlation coefficient (R) of 0.629 and weighted average of 98.4%, a difference of 2.5%.
4th Grade Correlation Summary
| Measurement | Dominican | Dutch |
| Minimum | 90.2% | 96.5% |
| Maximum | 100.0% | 100.0% |
| Range | 9.8% | 3.5% |
| Mean | 95.4% | 99.3% |
| Median | 95.5% | 99.3% |
| Interquartile 25% (IQ1) | 93.8% | 98.9% |
| Interquartile 75% (IQ3) | 96.7% | 99.7% |
| Interquartile Range (IQR) | 2.9% | 0.86% |
| Standard Deviation (Sample) | 2.1% | 0.64% |
| Standard Deviation (Population) | 2.1% | 0.64% |
Similar Demographics by 4th Grade
Demographics Similar to Dominicans by 4th Grade
In terms of 4th grade, the demographic groups most similar to Dominicans are Immigrants from Belize (96.0%, a difference of 0.010%), Hispanic or Latino (96.0%, a difference of 0.010%), Immigrants from Nicaragua (96.0%, a difference of 0.020%), Honduran (96.0%, a difference of 0.020%), and Japanese (96.0%, a difference of 0.040%).
| Demographics | Rating | Rank | 4th Grade |
| Immigrants | Azores | 0.0 /100 | #318 | Tragic 96.1% |
| Belizeans | 0.0 /100 | #319 | Tragic 96.1% |
| Bangladeshis | 0.0 /100 | #320 | Tragic 96.1% |
| Japanese | 0.0 /100 | #321 | Tragic 96.0% |
| Immigrants | Vietnam | 0.0 /100 | #322 | Tragic 96.0% |
| Immigrants | Nicaragua | 0.0 /100 | #323 | Tragic 96.0% |
| Immigrants | Belize | 0.0 /100 | #324 | Tragic 96.0% |
| Dominicans | 0.0 /100 | #325 | Tragic 96.0% |
| Hispanics or Latinos | 0.0 /100 | #326 | Tragic 96.0% |
| Hondurans | 0.0 /100 | #327 | Tragic 96.0% |
| Mexican American Indians | 0.0 /100 | #328 | Tragic 95.8% |
| Immigrants | Cambodia | 0.0 /100 | #329 | Tragic 95.8% |
| Immigrants | Fiji | 0.0 /100 | #330 | Tragic 95.8% |
| Immigrants | Armenia | 0.0 /100 | #331 | Tragic 95.8% |
| Immigrants | Honduras | 0.0 /100 | #332 | Tragic 95.8% |
Demographics Similar to Dutch by 4th Grade
In terms of 4th grade, the demographic groups most similar to Dutch are Scottish (98.4%, a difference of 0.0%), Pennsylvania German (98.4%, a difference of 0.0%), Polish (98.4%, a difference of 0.010%), Irish (98.4%, a difference of 0.020%), and Alaska Native (98.4%, a difference of 0.020%).
| Demographics | Rating | Rank | 4th Grade |
| Germans | 100.0 /100 | #8 | Exceptional 98.5% |
| Slovenes | 100.0 /100 | #9 | Exceptional 98.4% |
| Alaskan Athabascans | 100.0 /100 | #10 | Exceptional 98.4% |
| English | 100.0 /100 | #11 | Exceptional 98.4% |
| Tlingit-Haida | 100.0 /100 | #12 | Exceptional 98.4% |
| Swedes | 100.0 /100 | #13 | Exceptional 98.4% |
| Carpatho Rusyns | 100.0 /100 | #14 | Exceptional 98.4% |
| Dutch | 100.0 /100 | #15 | Exceptional 98.4% |
| Scottish | 100.0 /100 | #16 | Exceptional 98.4% |
| Pennsylvania Germans | 100.0 /100 | #17 | Exceptional 98.4% |
| Poles | 100.0 /100 | #18 | Exceptional 98.4% |
| Irish | 100.0 /100 | #19 | Exceptional 98.4% |
| Alaska Natives | 100.0 /100 | #20 | Exceptional 98.4% |
| Lithuanians | 100.0 /100 | #21 | Exceptional 98.3% |
| Finns | 100.0 /100 | #22 | Exceptional 98.3% |