Dominican vs Ethiopian 7th Grade
COMPARE
Dominican
Ethiopian
7th Grade
7th Grade Comparison
Dominicans
Ethiopians
93.3%
7TH GRADE
0.0/ 100
METRIC RATING
324th/ 347
METRIC RANK
95.4%
7TH GRADE
1.5/ 100
METRIC RATING
246th/ 347
METRIC RANK
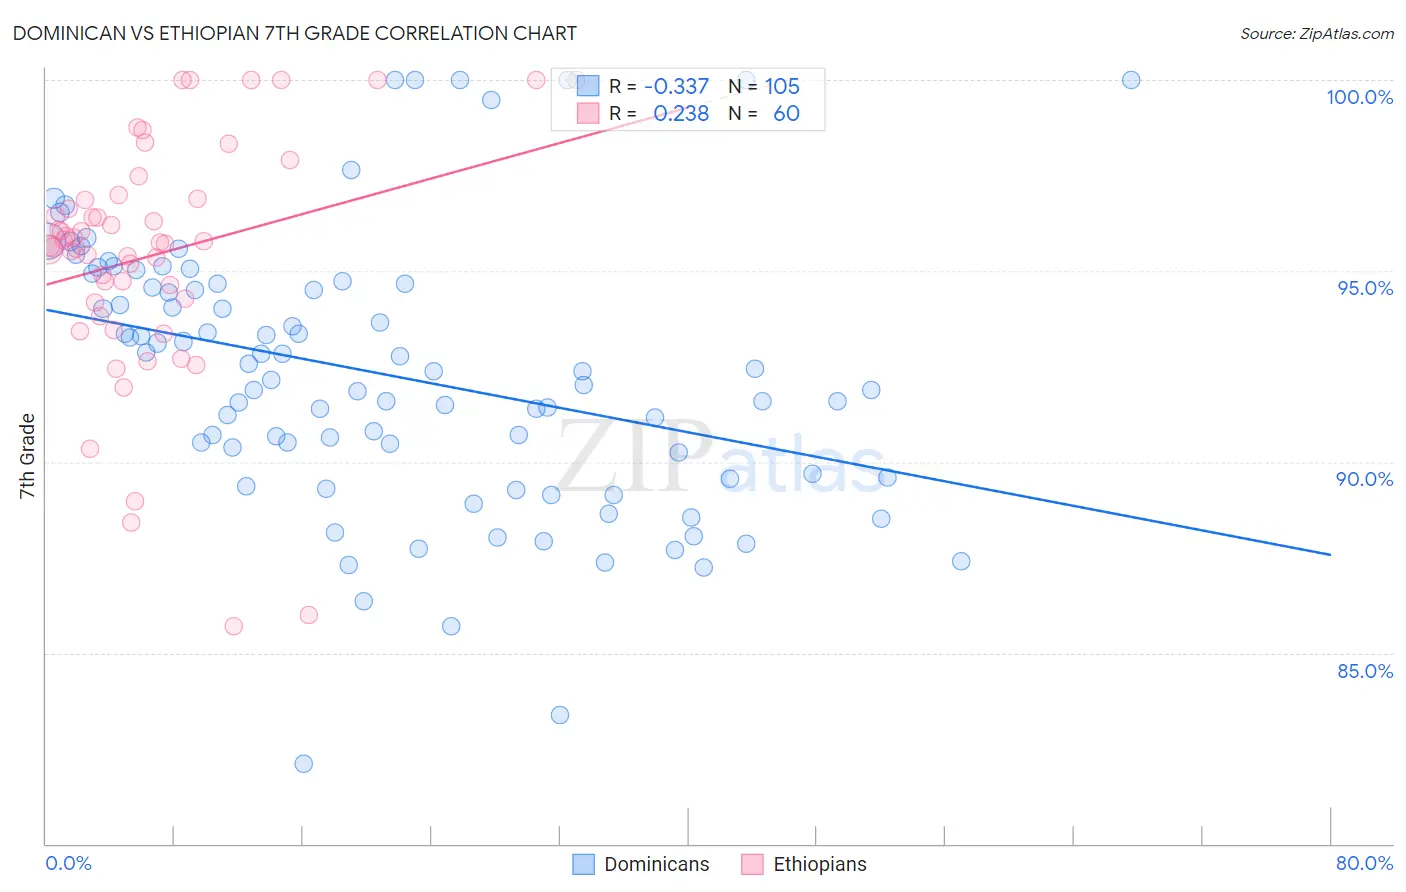
Dominican vs Ethiopian 7th Grade Correlation Chart
The statistical analysis conducted on geographies consisting of 355,142,603 people shows a mild negative correlation between the proportion of Dominicans and percentage of population with at least 7th grade education in the United States with a correlation coefficient (R) of -0.337 and weighted average of 93.3%. Similarly, the statistical analysis conducted on geographies consisting of 223,161,778 people shows a weak positive correlation between the proportion of Ethiopians and percentage of population with at least 7th grade education in the United States with a correlation coefficient (R) of 0.238 and weighted average of 95.4%, a difference of 2.2%.
7th Grade Correlation Summary
| Measurement | Dominican | Ethiopian |
| Minimum | 82.1% | 85.7% |
| Maximum | 100.0% | 100.0% |
| Range | 17.9% | 14.3% |
| Mean | 92.3% | 95.4% |
| Median | 92.4% | 95.7% |
| Interquartile 25% (IQ1) | 89.6% | 94.2% |
| Interquartile 75% (IQ3) | 94.7% | 96.9% |
| Interquartile Range (IQR) | 5.0% | 2.7% |
| Standard Deviation (Sample) | 3.6% | 3.1% |
| Standard Deviation (Population) | 3.6% | 3.1% |
Similar Demographics by 7th Grade
Demographics Similar to Dominicans by 7th Grade
In terms of 7th grade, the demographic groups most similar to Dominicans are Immigrants from Belize (93.4%, a difference of 0.020%), Central American Indian (93.3%, a difference of 0.070%), Nicaraguan (93.5%, a difference of 0.13%), Belizean (93.5%, a difference of 0.16%), and Nepalese (93.2%, a difference of 0.18%).
| Demographics | Rating | Rank | 7th Grade |
| Immigrants | Cuba | 0.0 /100 | #317 | Tragic 93.8% |
| Immigrants | Ecuador | 0.0 /100 | #318 | Tragic 93.7% |
| Immigrants | Cambodia | 0.0 /100 | #319 | Tragic 93.7% |
| Immigrants | Fiji | 0.0 /100 | #320 | Tragic 93.5% |
| Belizeans | 0.0 /100 | #321 | Tragic 93.5% |
| Nicaraguans | 0.0 /100 | #322 | Tragic 93.5% |
| Immigrants | Belize | 0.0 /100 | #323 | Tragic 93.4% |
| Dominicans | 0.0 /100 | #324 | Tragic 93.3% |
| Central American Indians | 0.0 /100 | #325 | Tragic 93.3% |
| Nepalese | 0.0 /100 | #326 | Tragic 93.2% |
| Immigrants | Cabo Verde | 0.0 /100 | #327 | Tragic 93.1% |
| Immigrants | Nicaragua | 0.0 /100 | #328 | Tragic 93.0% |
| Immigrants | Azores | 0.0 /100 | #329 | Tragic 93.0% |
| Immigrants | Dominican Republic | 0.0 /100 | #330 | Tragic 92.9% |
| Hondurans | 0.0 /100 | #331 | Tragic 92.9% |
Demographics Similar to Ethiopians by 7th Grade
In terms of 7th grade, the demographic groups most similar to Ethiopians are Uruguayan (95.4%, a difference of 0.010%), Immigrants from Middle Africa (95.4%, a difference of 0.010%), U.S. Virgin Islander (95.4%, a difference of 0.020%), Tongan (95.4%, a difference of 0.020%), and Immigrants from Senegal (95.5%, a difference of 0.040%).
| Demographics | Rating | Rank | 7th Grade |
| Jamaicans | 2.2 /100 | #239 | Tragic 95.5% |
| Immigrants | Sierra Leone | 2.0 /100 | #240 | Tragic 95.5% |
| South American Indians | 2.0 /100 | #241 | Tragic 95.5% |
| Immigrants | Senegal | 1.9 /100 | #242 | Tragic 95.5% |
| U.S. Virgin Islanders | 1.6 /100 | #243 | Tragic 95.4% |
| Uruguayans | 1.6 /100 | #244 | Tragic 95.4% |
| Immigrants | Middle Africa | 1.5 /100 | #245 | Tragic 95.4% |
| Ethiopians | 1.5 /100 | #246 | Tragic 95.4% |
| Tongans | 1.3 /100 | #247 | Tragic 95.4% |
| Paiute | 1.2 /100 | #248 | Tragic 95.4% |
| Bolivians | 1.1 /100 | #249 | Tragic 95.4% |
| Immigrants | Cameroon | 0.9 /100 | #250 | Tragic 95.4% |
| Immigrants | Jamaica | 0.9 /100 | #251 | Tragic 95.4% |
| Immigrants | Ethiopia | 0.9 /100 | #252 | Tragic 95.3% |
| Somalis | 0.9 /100 | #253 | Tragic 95.3% |