Dominican vs Immigrants from Asia 7th Grade
COMPARE
Dominican
Immigrants from Asia
7th Grade
7th Grade Comparison
Dominicans
Immigrants from Asia
93.3%
7TH GRADE
0.0/ 100
METRIC RATING
324th/ 347
METRIC RANK
95.5%
7TH GRADE
2.3/ 100
METRIC RATING
237th/ 347
METRIC RANK
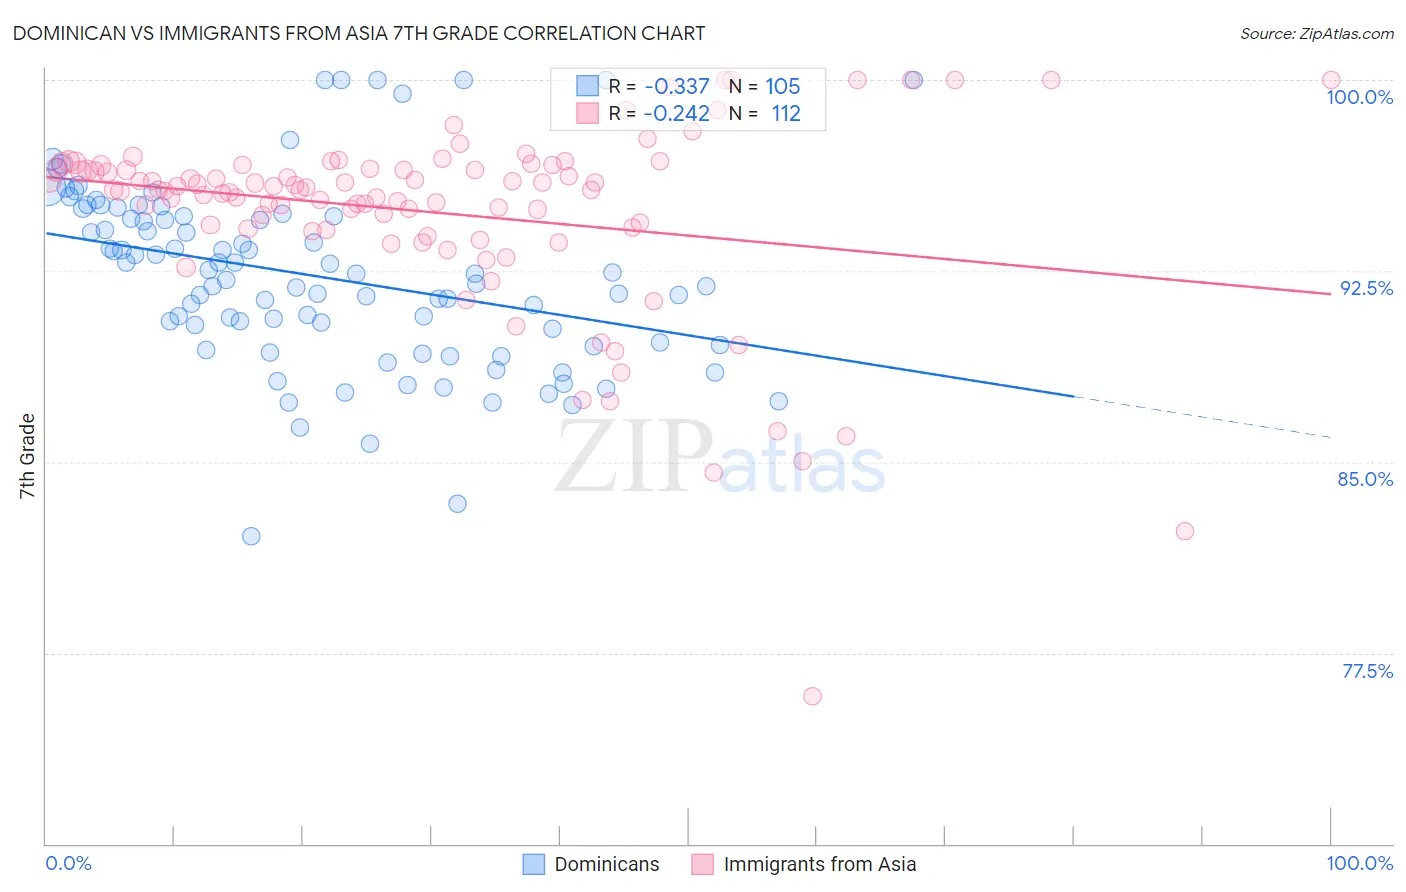
Dominican vs Immigrants from Asia 7th Grade Correlation Chart
The statistical analysis conducted on geographies consisting of 355,142,603 people shows a mild negative correlation between the proportion of Dominicans and percentage of population with at least 7th grade education in the United States with a correlation coefficient (R) of -0.337 and weighted average of 93.3%. Similarly, the statistical analysis conducted on geographies consisting of 549,167,442 people shows a weak negative correlation between the proportion of Immigrants from Asia and percentage of population with at least 7th grade education in the United States with a correlation coefficient (R) of -0.242 and weighted average of 95.5%, a difference of 2.3%.
7th Grade Correlation Summary
| Measurement | Dominican | Immigrants from Asia |
| Minimum | 82.1% | 75.8% |
| Maximum | 100.0% | 100.0% |
| Range | 17.9% | 24.2% |
| Mean | 92.3% | 94.8% |
| Median | 92.4% | 95.7% |
| Interquartile 25% (IQ1) | 89.6% | 94.2% |
| Interquartile 75% (IQ3) | 94.7% | 96.6% |
| Interquartile Range (IQR) | 5.0% | 2.4% |
| Standard Deviation (Sample) | 3.6% | 3.8% |
| Standard Deviation (Population) | 3.6% | 3.7% |
Similar Demographics by 7th Grade
Demographics Similar to Dominicans by 7th Grade
In terms of 7th grade, the demographic groups most similar to Dominicans are Immigrants from Belize (93.4%, a difference of 0.020%), Central American Indian (93.3%, a difference of 0.070%), Nicaraguan (93.5%, a difference of 0.13%), Belizean (93.5%, a difference of 0.16%), and Nepalese (93.2%, a difference of 0.18%).
| Demographics | Rating | Rank | 7th Grade |
| Immigrants | Cuba | 0.0 /100 | #317 | Tragic 93.8% |
| Immigrants | Ecuador | 0.0 /100 | #318 | Tragic 93.7% |
| Immigrants | Cambodia | 0.0 /100 | #319 | Tragic 93.7% |
| Immigrants | Fiji | 0.0 /100 | #320 | Tragic 93.5% |
| Belizeans | 0.0 /100 | #321 | Tragic 93.5% |
| Nicaraguans | 0.0 /100 | #322 | Tragic 93.5% |
| Immigrants | Belize | 0.0 /100 | #323 | Tragic 93.4% |
| Dominicans | 0.0 /100 | #324 | Tragic 93.3% |
| Central American Indians | 0.0 /100 | #325 | Tragic 93.3% |
| Nepalese | 0.0 /100 | #326 | Tragic 93.2% |
| Immigrants | Cabo Verde | 0.0 /100 | #327 | Tragic 93.1% |
| Immigrants | Nicaragua | 0.0 /100 | #328 | Tragic 93.0% |
| Immigrants | Azores | 0.0 /100 | #329 | Tragic 93.0% |
| Immigrants | Dominican Republic | 0.0 /100 | #330 | Tragic 92.9% |
| Hondurans | 0.0 /100 | #331 | Tragic 92.9% |
Demographics Similar to Immigrants from Asia by 7th Grade
In terms of 7th grade, the demographic groups most similar to Immigrants from Asia are Indian (Asian) (95.5%, a difference of 0.0%), Asian (95.5%, a difference of 0.010%), Jamaican (95.5%, a difference of 0.010%), Immigrants from Africa (95.5%, a difference of 0.020%), and Immigrants from Sierra Leone (95.5%, a difference of 0.030%).
| Demographics | Rating | Rank | 7th Grade |
| Natives/Alaskans | 4.2 /100 | #230 | Tragic 95.6% |
| Senegalese | 4.0 /100 | #231 | Tragic 95.6% |
| Costa Ricans | 3.3 /100 | #232 | Tragic 95.5% |
| Immigrants | Indonesia | 3.3 /100 | #233 | Tragic 95.5% |
| Nigerians | 3.0 /100 | #234 | Tragic 95.5% |
| Immigrants | Africa | 2.7 /100 | #235 | Tragic 95.5% |
| Asians | 2.6 /100 | #236 | Tragic 95.5% |
| Immigrants | Asia | 2.3 /100 | #237 | Tragic 95.5% |
| Indians (Asian) | 2.3 /100 | #238 | Tragic 95.5% |
| Jamaicans | 2.2 /100 | #239 | Tragic 95.5% |
| Immigrants | Sierra Leone | 2.0 /100 | #240 | Tragic 95.5% |
| South American Indians | 2.0 /100 | #241 | Tragic 95.5% |
| Immigrants | Senegal | 1.9 /100 | #242 | Tragic 95.5% |
| U.S. Virgin Islanders | 1.6 /100 | #243 | Tragic 95.4% |
| Uruguayans | 1.6 /100 | #244 | Tragic 95.4% |