Immigrants from St. Vincent and the Grenadines vs Immigrants from Bolivia 9th Grade
COMPARE
Immigrants from St. Vincent and the Grenadines
Immigrants from Bolivia
9th Grade
9th Grade Comparison
Immigrants from St. Vincent and the Grenadines
Immigrants from Bolivia
93.4%
9TH GRADE
0.0/ 100
METRIC RATING
287th/ 347
METRIC RANK
93.9%
9TH GRADE
0.3/ 100
METRIC RATING
268th/ 347
METRIC RANK
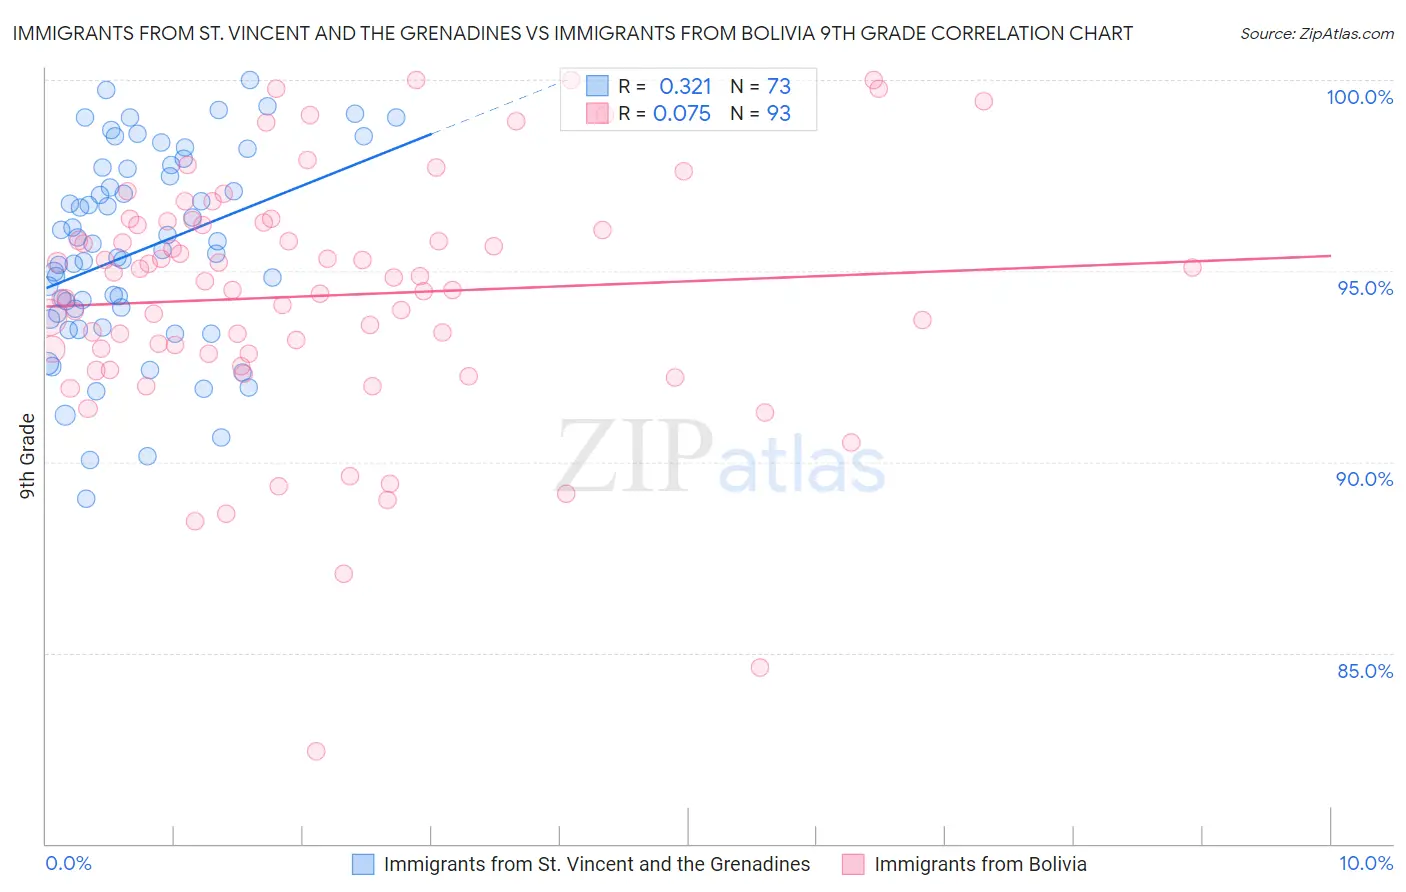
Immigrants from St. Vincent and the Grenadines vs Immigrants from Bolivia 9th Grade Correlation Chart
The statistical analysis conducted on geographies consisting of 56,191,418 people shows a mild positive correlation between the proportion of Immigrants from St. Vincent and the Grenadines and percentage of population with at least 9th grade education in the United States with a correlation coefficient (R) of 0.321 and weighted average of 93.4%. Similarly, the statistical analysis conducted on geographies consisting of 158,727,043 people shows a slight positive correlation between the proportion of Immigrants from Bolivia and percentage of population with at least 9th grade education in the United States with a correlation coefficient (R) of 0.075 and weighted average of 93.9%, a difference of 0.53%.
9th Grade Correlation Summary
| Measurement | Immigrants from St. Vincent and the Grenadines | Immigrants from Bolivia |
| Minimum | 89.0% | 82.4% |
| Maximum | 100.0% | 100.0% |
| Range | 11.0% | 17.6% |
| Mean | 95.5% | 94.3% |
| Median | 95.5% | 94.7% |
| Interquartile 25% (IQ1) | 93.8% | 92.8% |
| Interquartile 75% (IQ3) | 97.7% | 96.2% |
| Interquartile Range (IQR) | 3.9% | 3.4% |
| Standard Deviation (Sample) | 2.6% | 3.2% |
| Standard Deviation (Population) | 2.6% | 3.2% |
Demographics Similar to Immigrants from St. Vincent and the Grenadines and Immigrants from Bolivia by 9th Grade
In terms of 9th grade, the demographic groups most similar to Immigrants from St. Vincent and the Grenadines are Immigrants from Barbados (93.4%, a difference of 0.010%), Immigrants from Peru (93.4%, a difference of 0.040%), Bangladeshi (93.4%, a difference of 0.090%), Barbadian (93.5%, a difference of 0.15%), and Malaysian (93.5%, a difference of 0.17%). Similarly, the demographic groups most similar to Immigrants from Bolivia are Armenian (93.9%, a difference of 0.020%), Immigrants from Uruguay (93.8%, a difference of 0.040%), Yuman (93.8%, a difference of 0.050%), Immigrants from Ghana (93.8%, a difference of 0.070%), and Immigrants from Western Africa (93.8%, a difference of 0.080%).
| Demographics | Rating | Rank | 9th Grade |
| Armenians | 0.3 /100 | #267 | Tragic 93.9% |
| Immigrants | Bolivia | 0.3 /100 | #268 | Tragic 93.9% |
| Immigrants | Uruguay | 0.2 /100 | #269 | Tragic 93.8% |
| Yuman | 0.2 /100 | #270 | Tragic 93.8% |
| Immigrants | Ghana | 0.2 /100 | #271 | Tragic 93.8% |
| Immigrants | Western Africa | 0.2 /100 | #272 | Tragic 93.8% |
| Immigrants | South America | 0.2 /100 | #273 | Tragic 93.8% |
| Peruvians | 0.2 /100 | #274 | Tragic 93.8% |
| Immigrants | Colombia | 0.2 /100 | #275 | Tragic 93.8% |
| West Indians | 0.2 /100 | #276 | Tragic 93.7% |
| Immigrants | Philippines | 0.1 /100 | #277 | Tragic 93.7% |
| Immigrants | Eritrea | 0.1 /100 | #278 | Tragic 93.7% |
| Trinidadians and Tobagonians | 0.1 /100 | #279 | Tragic 93.7% |
| Taiwanese | 0.1 /100 | #280 | Tragic 93.6% |
| Immigrants | Trinidad and Tobago | 0.1 /100 | #281 | Tragic 93.6% |
| Malaysians | 0.0 /100 | #282 | Tragic 93.5% |
| Barbadians | 0.0 /100 | #283 | Tragic 93.5% |
| Bangladeshis | 0.0 /100 | #284 | Tragic 93.4% |
| Immigrants | Peru | 0.0 /100 | #285 | Tragic 93.4% |
| Immigrants | Barbados | 0.0 /100 | #286 | Tragic 93.4% |
| Immigrants | St. Vincent and the Grenadines | 0.0 /100 | #287 | Tragic 93.4% |