Delaware vs Cajun 11th Grade

COMPARE

Delaware
Race
Ancestry
AfghanAfricanAlaska NativeAlaskan AthabascanAlbanianAleutAlsatianAmericanApacheArabArapahoArgentineanArmenianAssyrian/Chaldean/SyriacAustralianAustrianBahamianBangladeshiBarbadianBasqueBelgianBelizeanBermudanBhutaneseBlackfeetBolivianBrazilianBritishBritish West IndianBulgarianBurmeseCambodianCanadianCape VerdeanCarpatho RusynCelticCentral AmericanCentral American IndianCherokeeCheyenneChickasawChileanChineseChippewaChoctawColombianColvilleComancheCosta RicanCreeCreekCroatianCrowCubanCypriotCzechCzechoslovakianDanishDelawareDominicanDutchDutch West IndianEastern EuropeanEcuadorianEgyptianEnglishEstonianEthiopianEuropeanFijianFilipinoFinnishFrenchFrench American IndianFrench CanadianGermanGerman RussianGhanaianGreekGuamanian/ChamorroGuatemalanGuyaneseHaitianHmongHonduranHopiHoumaHungarianIcelanderIndian (Asian)IndonesianInupiatIranianIraqiIrishIroquoisIsraeliItalianJamaicanJapaneseJordanianKenyanKiowaKoreanLaotianLatvianLebaneseLiberianLithuanianLumbeeLuxembourgerMacedonianMalaysianMalteseMarshalleseMenomineeMexicanMexican American IndianMongolianMoroccanNative HawaiianNavajoNepaleseNew ZealanderNicaraguanNigerianNorthern EuropeanNorwegianOkinawanOsageOttawaPaiutePakistaniPalestinianPanamanianParaguayanPennsylvania GermanPeruvianPimaPolishPortuguesePotawatomiPuebloPuerto RicanPuget Sound SalishRomanianRussianSalvadoranSamoanScandinavianScotch-IrishScottishSeminoleSenegaleseSerbianShoshoneSierra LeoneanSiouxSlavicSlovakSloveneSomaliSouth AfricanSouth AmericanSouth American IndianSoviet UnionSpaniardSpanishSpanish AmericanSpanish American IndianSri LankanSubsaharan AfricanSudaneseSwedishSwissSyrianTaiwaneseThaiTlingit-HaidaTohono O'OdhamTonganTrinidadian and TobagonianTsimshianTurkishU.S. Virgin IslanderUgandanUkrainianUruguayanUteVenezuelanVietnameseWelshWest IndianYakamaYaquiYugoslavianYumanYup'ikZimbabwean
Immigration
NonimmigrantsImmigrantsAfghanistanAfricaAlbaniaArgentinaArmeniaAsiaAustraliaAustriaBahamasBangladeshBarbadosBelarusBelgiumBelizeBoliviaBosnia and HerzegovinaBrazilBulgariaBurma/MyanmarCabo VerdeCambodiaCameroonCanadaCaribbeanCentral AmericaChileChinaColombiaCongoCosta RicaCroatiaCubaCzechoslovakiaDenmarkDominicaDominican RepublicEastern AfricaEastern AsiaEastern EuropeEcuadorEgyptEl SalvadorEnglandEritreaEthiopiaEuropeFijiFranceGermanyGhanaGreeceGrenadaGuatemalaGuyanaHaitiHondurasHong KongHungaryIndiaIndonesiaIranIraqIrelandIsraelItalyJamaicaJapanJordanKazakhstanKenyaKoreaKuwaitLaosLatin AmericaLatviaLebanonLiberiaLithuaniaMalaysiaMexicoMicronesiaMiddle AfricaMoldovaMoroccoNepalNetherlandsNicaraguaNigeriaNorth AmericaNorth MacedoniaNorthern AfricaNorthern EuropeNorwayOceaniaPakistanPanamaPeruPhilippinesPolandPortugalRomaniaRussiaSaudi ArabiaScotlandSenegalSerbiaSierra LeoneSingaporeSomaliaSouth AfricaSouth AmericaSouth Central AsiaSouth Eastern AsiaSouthern EuropeSpainSri LankaSt. Vincent and the GrenadinesSudanSwedenSwitzerlandSyriaTaiwanThailandTrinidad and TobagoTurkeyUgandaUkraineUruguayUzbekistanVenezuelaVietnamWest IndiesWestern AfricaWestern AsiaWestern EuropeYemenZaireZimbabweAzores
Cajun
Race
Ancestry
AfghanAfricanAlaska NativeAlaskan AthabascanAlbanianAleutAlsatianAmericanApacheArabArapahoArgentineanArmenianAssyrian/Chaldean/SyriacAustralianAustrianBahamianBangladeshiBarbadianBasqueBelgianBelizeanBermudanBhutaneseBlackfeetBolivianBrazilianBritishBritish West IndianBulgarianBurmeseCajunCambodianCanadianCape VerdeanCarpatho RusynCelticCentral AmericanCentral American IndianCherokeeCheyenneChickasawChileanChineseChippewaChoctawColombianColvilleComancheCosta RicanCreeCreekCroatianCrowCubanCypriotCzechCzechoslovakianDanishDominicanDutchDutch West IndianEastern EuropeanEcuadorianEgyptianEnglishEstonianEthiopianEuropeanFijianFilipinoFinnishFrenchFrench American IndianFrench CanadianGermanGerman RussianGhanaianGreekGuamanian/ChamorroGuatemalanGuyaneseHaitianHmongHonduranHopiHoumaHungarianIcelanderIndian (Asian)IndonesianInupiatIranianIraqiIrishIroquoisIsraeliItalianJamaicanJapaneseJordanianKenyanKiowaKoreanLaotianLatvianLebaneseLiberianLithuanianLumbeeLuxembourgerMacedonianMalaysianMalteseMarshalleseMenomineeMexicanMexican American IndianMongolianMoroccanNative HawaiianNavajoNepaleseNew ZealanderNicaraguanNigerianNorthern EuropeanNorwegianOkinawanOsageOttawaPaiutePakistaniPalestinianPanamanianParaguayanPennsylvania GermanPeruvianPimaPolishPortuguesePotawatomiPuebloPuerto RicanPuget Sound SalishRomanianRussianSalvadoranSamoanScandinavianScotch-IrishScottishSeminoleSenegaleseSerbianShoshoneSierra LeoneanSiouxSlavicSlovakSloveneSomaliSouth AfricanSouth AmericanSouth American IndianSoviet UnionSpaniardSpanishSpanish AmericanSpanish American IndianSri LankanSubsaharan AfricanSudaneseSwedishSwissSyrianTaiwaneseThaiTlingit-HaidaTohono O'OdhamTonganTrinidadian and TobagonianTsimshianTurkishU.S. Virgin IslanderUgandanUkrainianUruguayanUteVenezuelanVietnameseWelshWest IndianYakamaYaquiYugoslavianYumanYup'ikZimbabwean
Immigration
NonimmigrantsImmigrantsAfghanistanAfricaAlbaniaArgentinaArmeniaAsiaAustraliaAustriaBahamasBangladeshBarbadosBelarusBelgiumBelizeBoliviaBosnia and HerzegovinaBrazilBulgariaBurma/MyanmarCabo VerdeCambodiaCameroonCanadaCaribbeanCentral AmericaChileChinaColombiaCongoCosta RicaCroatiaCubaCzechoslovakiaDenmarkDominicaDominican RepublicEastern AfricaEastern AsiaEastern EuropeEcuadorEgyptEl SalvadorEnglandEritreaEthiopiaEuropeFijiFranceGermanyGhanaGreeceGrenadaGuatemalaGuyanaHaitiHondurasHong KongHungaryIndiaIndonesiaIranIraqIrelandIsraelItalyJamaicaJapanJordanKazakhstanKenyaKoreaKuwaitLaosLatin AmericaLatviaLebanonLiberiaLithuaniaMalaysiaMexicoMicronesiaMiddle AfricaMoldovaMoroccoNepalNetherlandsNicaraguaNigeriaNorth AmericaNorth MacedoniaNorthern AfricaNorthern EuropeNorwayOceaniaPakistanPanamaPeruPhilippinesPolandPortugalRomaniaRussiaSaudi ArabiaScotlandSenegalSerbiaSierra LeoneSingaporeSomaliaSouth AfricaSouth AmericaSouth Central AsiaSouth Eastern AsiaSouthern EuropeSpainSri LankaSt. Vincent and the GrenadinesSudanSwedenSwitzerlandSyriaTaiwanThailandTrinidad and TobagoTurkeyUgandaUkraineUruguayUzbekistanVenezuelaVietnamWest IndiesWestern AfricaWestern AsiaWestern EuropeYemenZaireZimbabweAzores
11th Grade
Income
Poverty
Unemployment
Labor Participation
Family Structure
Vehicle Availability
Education Level
Disability

11th Grade Comparison

Delaware

Cajuns

Excellent
Tragic
93.0%
11TH GRADE
87.3/ 100
METRIC RATING
134th/ 347
METRIC RANK
91.4%
11TH GRADE
0.7/ 100
METRIC RATING
257th/ 347
METRIC RANK

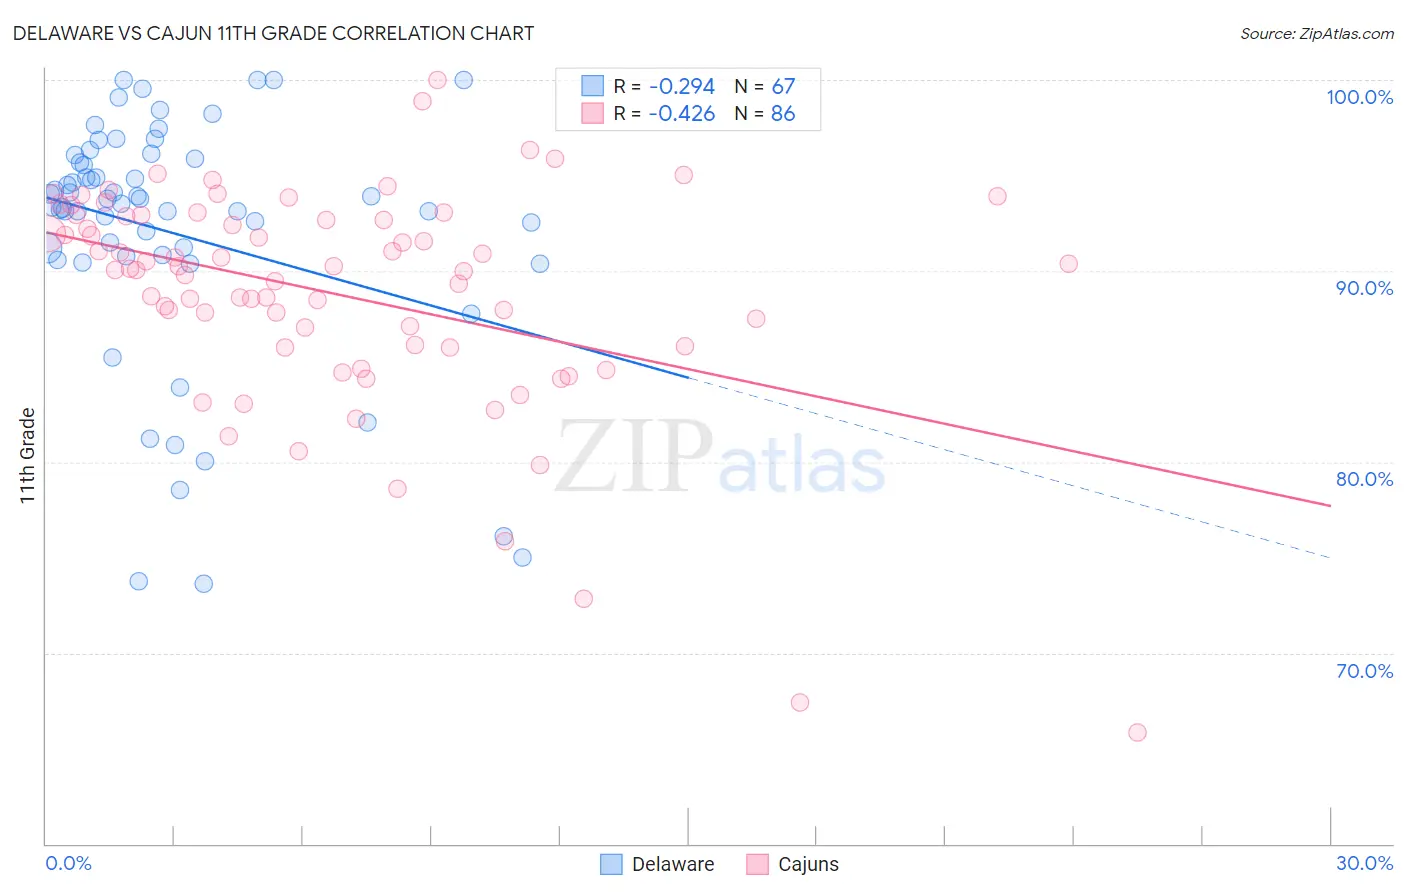
Delaware vs Cajun 11th Grade Correlation Chart

The statistical analysis conducted on geographies consisting of 96,234,866 people shows a weak negative correlation between the proportion of Delaware and percentage of population with at least 11th grade education in the United States with a correlation coefficient (R) of -0.294 and weighted average of 93.0%. Similarly, the statistical analysis conducted on geographies consisting of 149,713,149 people shows a moderate negative correlation between the proportion of Cajuns and percentage of population with at least 11th grade education in the United States with a correlation coefficient (R) of -0.426 and weighted average of 91.4%, a difference of 1.7%.
Delaware vs Cajun 11th Grade

11th Grade Correlation Summary

MeasurementDelawareCajun
Minimum73.6%65.8%
Maximum100.0%100.0%
Range26.4%34.2%
Mean92.0%88.8%
Median93.5%90.1%
Interquartile 25% (IQ1)90.8%86.0%
Interquartile 75% (IQ3)95.9%92.9%
Interquartile Range (IQR)5.1%6.8%
Standard Deviation (Sample)6.5%5.9%
Standard Deviation (Population)6.4%5.9%

Similar Demographics by 11th Grade

Demographics Similar to Delaware by 11th Grade

In terms of 11th grade, the demographic groups most similar to Delaware are Mongolian (93.0%, a difference of 0.010%), Immigrants from Italy (92.9%, a difference of 0.020%), Cree (92.9%, a difference of 0.030%), Immigrants from Bosnia and Herzegovina (93.0%, a difference of 0.040%), and Arab (92.9%, a difference of 0.040%).
DemographicsRating | Rank11th Grade
Immigrants | Kazakhstan
92.4
/100
|
#127
Exceptional
93.1%
Immigrants | Jordan
92.4
/100
|
#128
Exceptional
93.1%
Immigrants | Ukraine
89.8
/100
|
#129
Excellent
93.0%
Albanians
89.5
/100
|
#130
Excellent
93.0%
Egyptians
89.5
/100
|
#131
Excellent
93.0%
Immigrants | Bosnia and Herzegovina
89.0
/100
|
#132
Excellent
93.0%
Mongolians
87.6
/100
|
#133
Excellent
93.0%
Delaware
87.3
/100
|
#134
Excellent
93.0%
Immigrants | Italy
86.6
/100
|
#135
Excellent
92.9%
Cree
85.9
/100
|
#136
Excellent
92.9%
Arabs
85.4
/100
|
#137
Excellent
92.9%
Immigrants | Brazil
85.1
/100
|
#138
Excellent
92.9%
Crow
84.1
/100
|
#139
Excellent
92.9%
Venezuelans
83.4
/100
|
#140
Excellent
92.9%
Chileans
83.0
/100
|
#141
Excellent
92.9%

Demographics Similar to Cajuns by 11th Grade

In terms of 11th grade, the demographic groups most similar to Cajuns are Black/African American (91.4%, a difference of 0.010%), Immigrants from Senegal (91.4%, a difference of 0.010%), Immigrants from Eritrea (91.4%, a difference of 0.020%), Immigrants from Colombia (91.4%, a difference of 0.020%), and Jamaican (91.4%, a difference of 0.030%).
DemographicsRating | Rank11th Grade
Ghanaians
0.9
/100
|
#250
Tragic
91.5%
Immigrants | Costa Rica
0.9
/100
|
#251
Tragic
91.4%
Immigrants | Nigeria
0.8
/100
|
#252
Tragic
91.4%
Immigrants | South America
0.8
/100
|
#253
Tragic
91.4%
Immigrants | Eritrea
0.7
/100
|
#254
Tragic
91.4%
Blacks/African Americans
0.7
/100
|
#255
Tragic
91.4%
Immigrants | Senegal
0.7
/100
|
#256
Tragic
91.4%
Cajuns
0.7
/100
|
#257
Tragic
91.4%
Immigrants | Colombia
0.6
/100
|
#258
Tragic
91.4%
Jamaicans
0.6
/100
|
#259
Tragic
91.4%
Spanish Americans
0.6
/100
|
#260
Tragic
91.4%
Taiwanese
0.6
/100
|
#261
Tragic
91.3%
Immigrants | Uruguay
0.5
/100
|
#262
Tragic
91.3%
Immigrants | Ghana
0.3
/100
|
#263
Tragic
91.2%
Yup'ik
0.3
/100
|
#264
Tragic
91.2%