Danish vs Finnish Professional Degree
COMPARE
Danish
Finnish
Professional Degree
Professional Degree Comparison
Danes
Finns
4.4%
PROFESSIONAL DEGREE
43.5/ 100
METRIC RATING
181st/ 347
METRIC RANK
4.2%
PROFESSIONAL DEGREE
18.7/ 100
METRIC RATING
201st/ 347
METRIC RANK
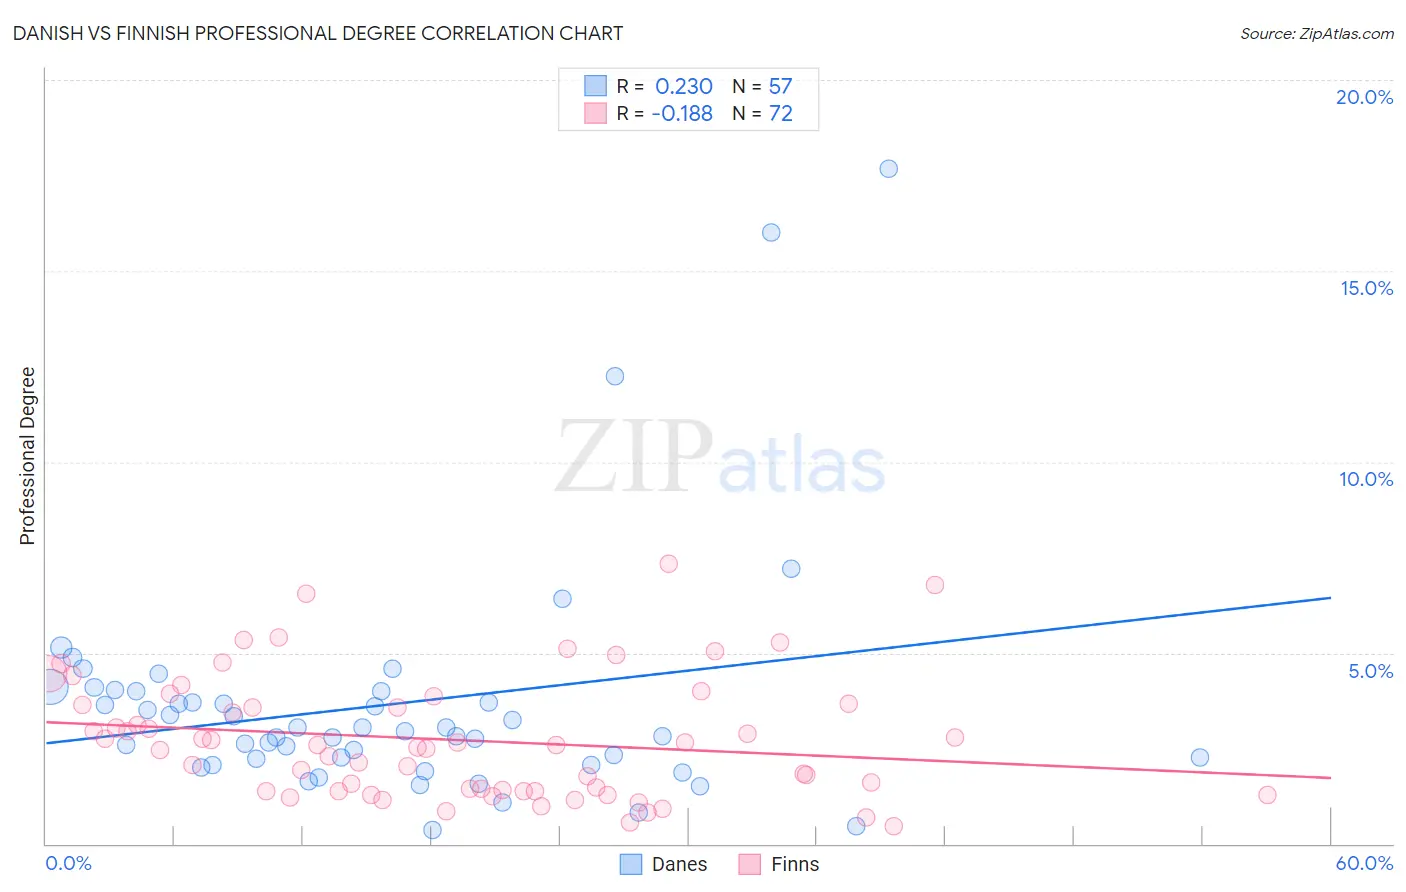
Danish vs Finnish Professional Degree Correlation Chart
The statistical analysis conducted on geographies consisting of 471,556,921 people shows a weak positive correlation between the proportion of Danes and percentage of population with at least professional degree education in the United States with a correlation coefficient (R) of 0.230 and weighted average of 4.4%. Similarly, the statistical analysis conducted on geographies consisting of 403,408,940 people shows a poor negative correlation between the proportion of Finns and percentage of population with at least professional degree education in the United States with a correlation coefficient (R) of -0.188 and weighted average of 4.2%, a difference of 4.6%.
Professional Degree Correlation Summary
| Measurement | Danish | Finnish |
| Minimum | 0.37% | 0.47% |
| Maximum | 17.7% | 7.3% |
| Range | 17.3% | 6.9% |
| Mean | 3.6% | 2.7% |
| Median | 2.9% | 2.5% |
| Interquartile 25% (IQ1) | 2.1% | 1.4% |
| Interquartile 75% (IQ3) | 4.0% | 3.6% |
| Interquartile Range (IQR) | 1.8% | 2.3% |
| Standard Deviation (Sample) | 3.1% | 1.6% |
| Standard Deviation (Population) | 3.1% | 1.6% |
Demographics Similar to Danes and Finns by Professional Degree
In terms of professional degree, the demographic groups most similar to Danes are Immigrants (4.4%, a difference of 0.040%), Bermudan (4.4%, a difference of 0.060%), Belgian (4.3%, a difference of 1.1%), Welsh (4.3%, a difference of 1.2%), and Scotch-Irish (4.3%, a difference of 1.5%). Similarly, the demographic groups most similar to Finns are Immigrants from North Macedonia (4.2%, a difference of 0.36%), Norwegian (4.2%, a difference of 0.44%), Immigrants from Middle Africa (4.2%, a difference of 0.80%), Czechoslovakian (4.2%, a difference of 0.86%), and Spanish (4.2%, a difference of 1.0%).
| Demographics | Rating | Rank | Professional Degree |
| Danes | 43.5 /100 | #181 | Average 4.4% |
| Immigrants | Immigrants | 43.2 /100 | #182 | Average 4.4% |
| Bermudans | 43.1 /100 | #183 | Average 4.4% |
| Belgians | 36.2 /100 | #184 | Fair 4.3% |
| Welsh | 35.8 /100 | #185 | Fair 4.3% |
| Scotch-Irish | 34.2 /100 | #186 | Fair 4.3% |
| Immigrants | Cameroon | 33.3 /100 | #187 | Fair 4.3% |
| Immigrants | Thailand | 31.7 /100 | #188 | Fair 4.3% |
| Slovaks | 30.7 /100 | #189 | Fair 4.3% |
| Immigrants | Poland | 29.2 /100 | #190 | Fair 4.3% |
| Sri Lankans | 29.0 /100 | #191 | Fair 4.3% |
| Ghanaians | 27.3 /100 | #192 | Fair 4.3% |
| French | 27.1 /100 | #193 | Fair 4.2% |
| Scandinavians | 25.8 /100 | #194 | Fair 4.2% |
| Nigerians | 24.6 /100 | #195 | Fair 4.2% |
| Spanish | 23.0 /100 | #196 | Fair 4.2% |
| Czechoslovakians | 22.4 /100 | #197 | Fair 4.2% |
| Immigrants | Middle Africa | 22.1 /100 | #198 | Fair 4.2% |
| Norwegians | 20.5 /100 | #199 | Fair 4.2% |
| Immigrants | North Macedonia | 20.2 /100 | #200 | Fair 4.2% |
| Finns | 18.7 /100 | #201 | Poor 4.2% |