Danish vs Immigrants from Scotland Associate's Degree

COMPARE

Danish
Race
Ancestry
AfghanAfricanAlaska NativeAlaskan AthabascanAlbanianAleutAlsatianAmericanApacheArabArapahoArgentineanArmenianAssyrian/Chaldean/SyriacAustralianAustrianBahamianBangladeshiBarbadianBasqueBelgianBelizeanBermudanBhutaneseBlackfeetBolivianBrazilianBritishBritish West IndianBulgarianBurmeseCajunCambodianCanadianCape VerdeanCarpatho RusynCelticCentral AmericanCentral American IndianCherokeeCheyenneChickasawChileanChineseChippewaChoctawColombianColvilleComancheCosta RicanCreeCreekCroatianCrowCubanCypriotCzechCzechoslovakianDanishDelawareDominicanDutchDutch West IndianEastern EuropeanEcuadorianEgyptianEnglishEstonianEthiopianEuropeanFijianFilipinoFinnishFrenchFrench American IndianFrench CanadianGermanGerman RussianGhanaianGreekGuamanian/ChamorroGuatemalanGuyaneseHaitianHmongHonduranHopiHoumaHungarianIcelanderIndian (Asian)IndonesianInupiatIranianIraqiIrishIroquoisIsraeliItalianJamaicanJapaneseJordanianKenyanKiowaKoreanLaotianLatvianLebaneseLiberianLithuanianLumbeeLuxembourgerMacedonianMalaysianMalteseMarshalleseMenomineeMexicanMexican American IndianMongolianMoroccanNative HawaiianNavajoNepaleseNew ZealanderNicaraguanNigerianNorthern EuropeanNorwegianOkinawanOsageOttawaPaiutePakistaniPalestinianPanamanianParaguayanPennsylvania GermanPeruvianPimaPolishPortuguesePotawatomiPuebloPuerto RicanPuget Sound SalishRomanianRussianSalvadoranSamoanScandinavianScotch-IrishScottishSeminoleSenegaleseSerbianShoshoneSierra LeoneanSiouxSlavicSlovakSloveneSomaliSouth AfricanSouth AmericanSouth American IndianSoviet UnionSpaniardSpanishSpanish AmericanSpanish American IndianSri LankanSubsaharan AfricanSudaneseSwedishSwissSyrianTaiwaneseThaiTlingit-HaidaTohono O'OdhamTonganTrinidadian and TobagonianTsimshianTurkishU.S. Virgin IslanderUgandanUkrainianUruguayanUteVenezuelanVietnameseWelshWest IndianYakamaYaquiYugoslavianYumanYup'ikZimbabwean
Immigration
NonimmigrantsImmigrantsAfghanistanAfricaAlbaniaArgentinaArmeniaAsiaAustraliaAustriaBahamasBangladeshBarbadosBelarusBelgiumBelizeBoliviaBosnia and HerzegovinaBrazilBulgariaBurma/MyanmarCabo VerdeCambodiaCameroonCanadaCaribbeanCentral AmericaChileChinaColombiaCongoCosta RicaCroatiaCubaCzechoslovakiaDenmarkDominicaDominican RepublicEastern AfricaEastern AsiaEastern EuropeEcuadorEgyptEl SalvadorEnglandEritreaEthiopiaEuropeFijiFranceGermanyGhanaGreeceGrenadaGuatemalaGuyanaHaitiHondurasHong KongHungaryIndiaIndonesiaIranIraqIrelandIsraelItalyJamaicaJapanJordanKazakhstanKenyaKoreaKuwaitLaosLatin AmericaLatviaLebanonLiberiaLithuaniaMalaysiaMexicoMicronesiaMiddle AfricaMoldovaMoroccoNepalNetherlandsNicaraguaNigeriaNorth AmericaNorth MacedoniaNorthern AfricaNorthern EuropeNorwayOceaniaPakistanPanamaPeruPhilippinesPolandPortugalRomaniaRussiaSaudi ArabiaSenegalSerbiaSierra LeoneSingaporeSomaliaSouth AfricaSouth AmericaSouth Central AsiaSouth Eastern AsiaSouthern EuropeSpainSri LankaSt. Vincent and the GrenadinesSudanSwedenSwitzerlandSyriaTaiwanThailandTrinidad and TobagoTurkeyUgandaUkraineUruguayUzbekistanVenezuelaVietnamWest IndiesWestern AfricaWestern AsiaWestern EuropeYemenZaireZimbabweAzores
Immigrants from Scotland
Race
Ancestry
AfghanAfricanAlaska NativeAlaskan AthabascanAlbanianAleutAlsatianAmericanApacheArabArapahoArgentineanArmenianAssyrian/Chaldean/SyriacAustralianAustrianBahamianBangladeshiBarbadianBasqueBelgianBelizeanBermudanBhutaneseBlackfeetBolivianBrazilianBritishBritish West IndianBulgarianBurmeseCajunCambodianCanadianCape VerdeanCarpatho RusynCelticCentral AmericanCentral American IndianCherokeeCheyenneChickasawChileanChineseChippewaChoctawColombianColvilleComancheCosta RicanCreeCreekCroatianCrowCubanCypriotCzechCzechoslovakianDelawareDominicanDutchDutch West IndianEastern EuropeanEcuadorianEgyptianEnglishEstonianEthiopianEuropeanFijianFilipinoFinnishFrenchFrench American IndianFrench CanadianGermanGerman RussianGhanaianGreekGuamanian/ChamorroGuatemalanGuyaneseHaitianHmongHonduranHopiHoumaHungarianIcelanderIndian (Asian)IndonesianInupiatIranianIraqiIrishIroquoisIsraeliItalianJamaicanJapaneseJordanianKenyanKiowaKoreanLaotianLatvianLebaneseLiberianLithuanianLumbeeLuxembourgerMacedonianMalaysianMalteseMarshalleseMenomineeMexicanMexican American IndianMongolianMoroccanNative HawaiianNavajoNepaleseNew ZealanderNicaraguanNigerianNorthern EuropeanNorwegianOkinawanOsageOttawaPaiutePakistaniPalestinianPanamanianParaguayanPennsylvania GermanPeruvianPimaPolishPortuguesePotawatomiPuebloPuerto RicanPuget Sound SalishRomanianRussianSalvadoranSamoanScandinavianScotch-IrishScottishSeminoleSenegaleseSerbianShoshoneSierra LeoneanSiouxSlavicSlovakSloveneSomaliSouth AfricanSouth AmericanSouth American IndianSoviet UnionSpaniardSpanishSpanish AmericanSpanish American IndianSri LankanSubsaharan AfricanSudaneseSwedishSwissSyrianTaiwaneseThaiTlingit-HaidaTohono O'OdhamTonganTrinidadian and TobagonianTsimshianTurkishU.S. Virgin IslanderUgandanUkrainianUruguayanUteVenezuelanVietnameseWelshWest IndianYakamaYaquiYugoslavianYumanYup'ikZimbabwean
Immigration
NonimmigrantsImmigrantsAfghanistanAfricaAlbaniaArgentinaArmeniaAsiaAustraliaAustriaBahamasBangladeshBarbadosBelarusBelgiumBelizeBoliviaBosnia and HerzegovinaBrazilBulgariaBurma/MyanmarCabo VerdeCambodiaCameroonCanadaCaribbeanCentral AmericaChileChinaColombiaCongoCosta RicaCroatiaCubaCzechoslovakiaDenmarkDominicaDominican RepublicEastern AfricaEastern AsiaEastern EuropeEcuadorEgyptEl SalvadorEnglandEritreaEthiopiaEuropeFijiFranceGermanyGhanaGreeceGrenadaGuatemalaGuyanaHaitiHondurasHong KongHungaryIndiaIndonesiaIranIraqIrelandIsraelItalyJamaicaJapanJordanKazakhstanKenyaKoreaKuwaitLaosLatin AmericaLatviaLebanonLiberiaLithuaniaMalaysiaMexicoMicronesiaMiddle AfricaMoldovaMoroccoNepalNetherlandsNicaraguaNigeriaNorth AmericaNorth MacedoniaNorthern AfricaNorthern EuropeNorwayOceaniaPakistanPanamaPeruPhilippinesPolandPortugalRomaniaRussiaSaudi ArabiaScotlandSenegalSerbiaSierra LeoneSingaporeSomaliaSouth AfricaSouth AmericaSouth Central AsiaSouth Eastern AsiaSouthern EuropeSpainSri LankaSt. Vincent and the GrenadinesSudanSwedenSwitzerlandSyriaTaiwanThailandTrinidad and TobagoTurkeyUgandaUkraineUruguayUzbekistanVenezuelaVietnamWest IndiesWestern AfricaWestern AsiaWestern EuropeYemenZaireZimbabweAzores
Associate's Degree
Income
Poverty
Unemployment
Labor Participation
Family Structure
Vehicle Availability
Education Level
Disability

Associate's Degree Comparison

Danes

Immigrants from Scotland

Good
Exceptional
47.4%
ASSOCIATE'S DEGREE
77.3/ 100
METRIC RATING
147th/ 347
METRIC RANK
50.6%
ASSOCIATE'S DEGREE
99.3/ 100
METRIC RATING
75th/ 347
METRIC RANK

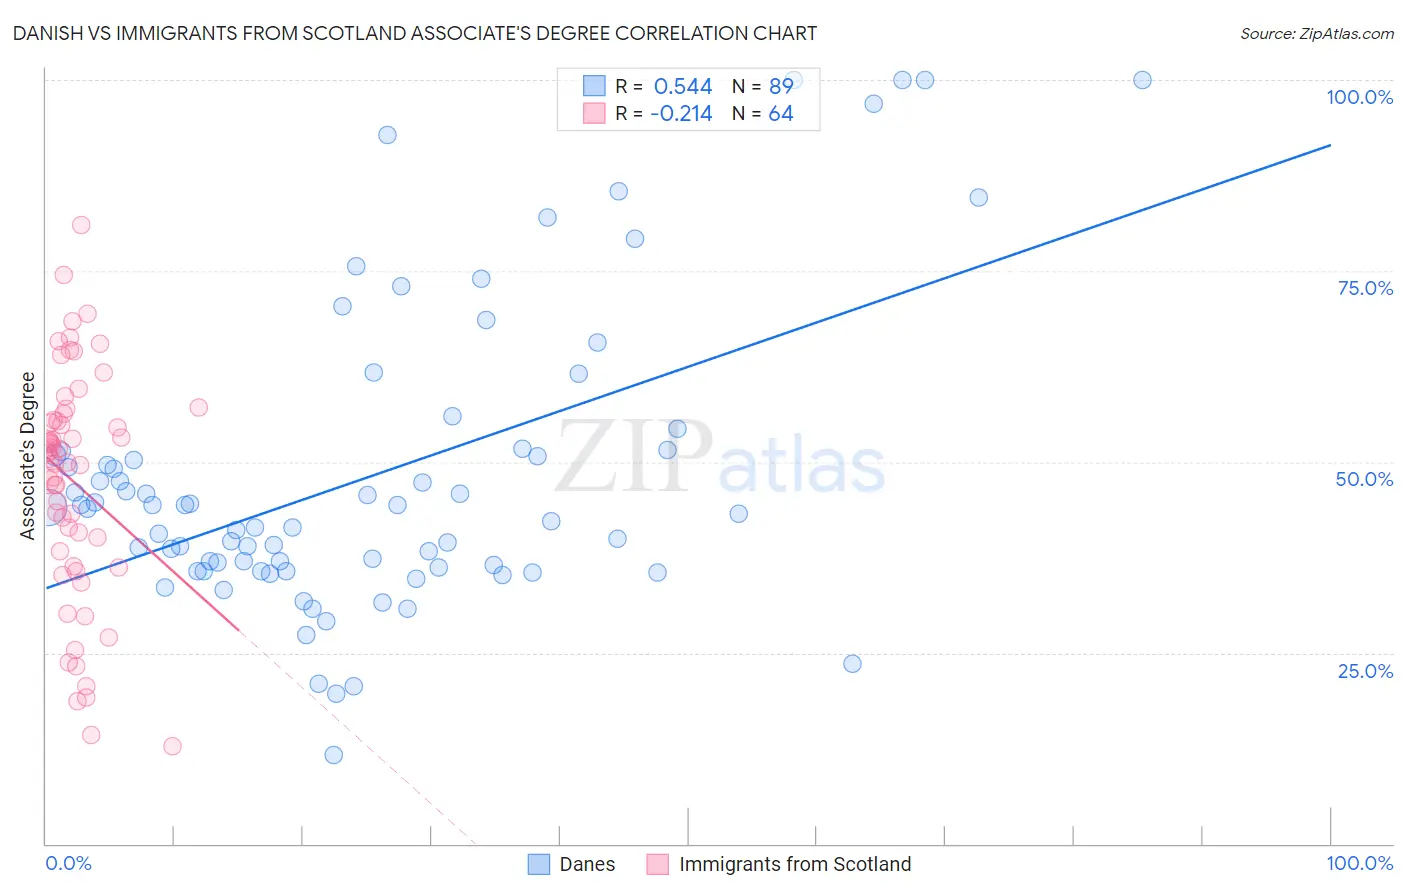
Danish vs Immigrants from Scotland Associate's Degree Correlation Chart

The statistical analysis conducted on geographies consisting of 474,170,437 people shows a substantial positive correlation between the proportion of Danes and percentage of population with at least associate's degree education in the United States with a correlation coefficient (R) of 0.544 and weighted average of 47.4%. Similarly, the statistical analysis conducted on geographies consisting of 196,397,243 people shows a weak negative correlation between the proportion of Immigrants from Scotland and percentage of population with at least associate's degree education in the United States with a correlation coefficient (R) of -0.214 and weighted average of 50.6%, a difference of 6.7%.
Danish vs Immigrants from Scotland Associate's Degree

Associate's Degree Correlation Summary

MeasurementDanishImmigrants from Scotland
Minimum11.7%12.7%
Maximum100.0%81.0%
Range88.3%68.2%
Mean48.1%47.4%
Median43.9%50.9%
Interquartile 25% (IQ1)36.0%37.3%
Interquartile 75% (IQ3)51.5%55.9%
Interquartile Range (IQR)15.5%18.6%
Standard Deviation (Sample)19.6%15.1%
Standard Deviation (Population)19.5%14.9%

Similar Demographics by Associate's Degree

Demographics Similar to Danes by Associate's Degree

In terms of associate's degree, the demographic groups most similar to Danes are Immigrants from Sudan (47.4%, a difference of 0.050%), South American Indian (47.4%, a difference of 0.060%), Immigrants from Armenia (47.4%, a difference of 0.070%), Iraqi (47.4%, a difference of 0.11%), and Immigrants from North Macedonia (47.4%, a difference of 0.14%).
DemographicsRating | RankAssociate's Degree
Immigrants | Southern Europe
84.4
/100
|
#140
Excellent
47.8%
Taiwanese
83.3
/100
|
#141
Excellent
47.7%
Sierra Leoneans
82.9
/100
|
#142
Excellent
47.7%
Norwegians
81.0
/100
|
#143
Excellent
47.6%
Slavs
80.5
/100
|
#144
Excellent
47.6%
Canadians
79.0
/100
|
#145
Good
47.5%
Immigrants | Sudan
77.9
/100
|
#146
Good
47.4%
Danes
77.3
/100
|
#147
Good
47.4%
South American Indians
76.7
/100
|
#148
Good
47.4%
Immigrants | Armenia
76.6
/100
|
#149
Good
47.4%
Iraqis
76.2
/100
|
#150
Good
47.4%
Immigrants | North Macedonia
76.0
/100
|
#151
Good
47.4%
Immigrants | Afghanistan
74.3
/100
|
#152
Good
47.3%
Czechs
72.2
/100
|
#153
Good
47.2%
Immigrants | Kenya
72.1
/100
|
#154
Good
47.2%

Demographics Similar to Immigrants from Scotland by Associate's Degree

In terms of associate's degree, the demographic groups most similar to Immigrants from Scotland are Lithuanian (50.6%, a difference of 0.040%), Carpatho Rusyn (50.6%, a difference of 0.10%), Immigrants from Zimbabwe (50.5%, a difference of 0.21%), Immigrants from Lebanon (50.5%, a difference of 0.24%), and Immigrants from Eastern Europe (50.5%, a difference of 0.29%).
DemographicsRating | RankAssociate's Degree
Immigrants | Indonesia
99.5
/100
|
#68
Exceptional
51.0%
Egyptians
99.5
/100
|
#69
Exceptional
50.9%
Immigrants | Argentina
99.5
/100
|
#70
Exceptional
50.9%
Immigrants | Romania
99.5
/100
|
#71
Exceptional
50.9%
Immigrants | Pakistan
99.5
/100
|
#72
Exceptional
50.9%
Carpatho Rusyns
99.3
/100
|
#73
Exceptional
50.6%
Lithuanians
99.3
/100
|
#74
Exceptional
50.6%
Immigrants | Scotland
99.3
/100
|
#75
Exceptional
50.6%
Immigrants | Zimbabwe
99.2
/100
|
#76
Exceptional
50.5%
Immigrants | Lebanon
99.1
/100
|
#77
Exceptional
50.5%
Immigrants | Eastern Europe
99.1
/100
|
#78
Exceptional
50.5%
Ethiopians
99.1
/100
|
#79
Exceptional
50.4%
Armenians
99.1
/100
|
#80
Exceptional
50.4%
Maltese
99.1
/100
|
#81
Exceptional
50.4%
Greeks
98.9
/100
|
#82
Exceptional
50.3%